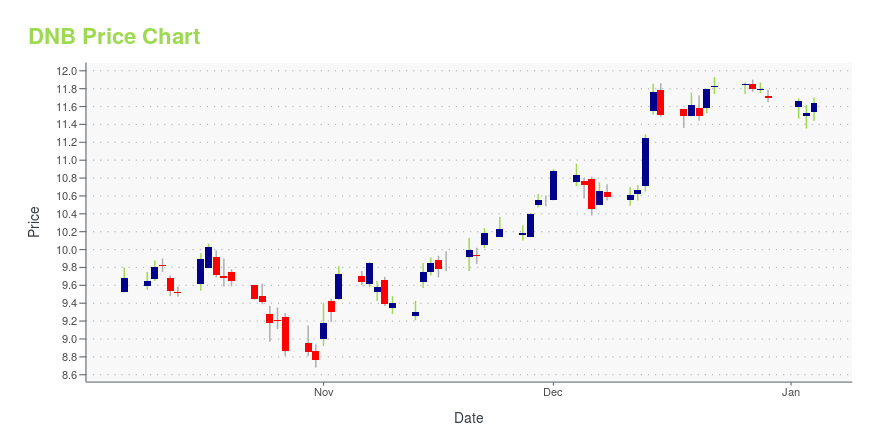
Dun & Bradstreet Corporation (The) (DNB): Price and Financial Metrics
DNB Price/Volume Stats
| Current price | $9.04 | 52-week high | $12.94 |
| Prev. close | $9.06 | 52-week low | $7.78 |
| Day low | $9.04 | Volume | 14,742,600 |
| Day high | $9.07 | Avg. volume | 10,372,066 |
| 50-day MA | $8.93 | Dividend yield | 2.21% |
| 200-day MA | $10.61 | Market Cap | 4.04B |
DNB Stock Price Chart Interactive Chart >
Dun & Bradstreet Corporation (The) (DNB) Company Bio
Dun & Bradstreet Holdings, Inc. operates as an investment holding company with interests in providing business decisioning data and analytics solutions for industry verticals, including financial services, technology, communications, government, retail, transportation and manufacturing. The company was founded on August 8, 2018 and is headquartered in Short Hills, NJ.
DNB Price Returns
| 1-mo | 0.67% |
| 3-mo | 12.16% |
| 6-mo | -25.84% |
| 1-year | 1.75% |
| 3-year | -35.25% |
| 5-year | N/A |
| YTD | -27.03% |
| 2024 | 8.46% |
| 2023 | -2.75% |
| 2022 | -39.73% |
| 2021 | -17.71% |
| 2020 | N/A |
DNB Dividends
| Ex-Dividend Date | Type | Payout Amount | Change | ||||||
|---|---|---|---|---|---|---|---|---|---|
| Loading, please wait... | |||||||||


Loading social stream, please wait...