Denali Therapeutics Inc. (DNLI): Price and Financial Metrics
GET POWR RATINGS... FREE!
DNLI POWR Grades
- DNLI scores best on the Value dimension, with a Value rank ahead of 51.56% of US stocks.
- DNLI's strongest trending metric is Growth; it's been moving down over the last 177 days.
- DNLI's current lowest rank is in the Growth metric (where it is better than 9.15% of US stocks).
DNLI Stock Summary
- Of note is the ratio of DENALI THERAPEUTICS INC's sales and general administrative expense to its total operating expenses; just 8.29% of US stocks have a lower such ratio.
- With a price/sales ratio of 28.86, DENALI THERAPEUTICS INC has a higher such ratio than 95.34% of stocks in our set.
- As for revenue growth, note that DNLI's revenue has grown 122.89% over the past 12 months; that beats the revenue growth of 94.38% of US companies in our set.
- Stocks with similar financial metrics, market capitalization, and price volatility to DENALI THERAPEUTICS INC are ARVN, FATE, XNCR, NTLA, and MORF.
- Visit DNLI's SEC page to see the company's official filings. To visit the company's web site, go to www.denalitherapeutics.com.
DNLI Valuation Summary
- DNLI's price/sales ratio is 28.9; this is 514.89% higher than that of the median Healthcare stock.
- DNLI's price/sales ratio has moved NA NA over the prior 64 months.
Below are key valuation metrics over time for DNLI.
Stock | Date | P/S | P/B | P/E | EV/EBIT |
---|---|---|---|---|---|
DNLI | 2023-03-24 | 28.9 | 3.0 | -9.6 | -9.1 |
DNLI | 2023-03-23 | 28.9 | 3.0 | -9.6 | -9.1 |
DNLI | 2023-03-22 | 28.5 | 3.0 | -9.5 | -9.0 |
DNLI | 2023-03-21 | 29.3 | 3.0 | -9.8 | -9.2 |
DNLI | 2023-03-20 | 29.4 | 3.1 | -9.8 | -9.3 |
DNLI | 2023-03-17 | 29.4 | 3.1 | -9.8 | -9.3 |
DNLI Growth Metrics
- Its year over year cash and equivalents growth rate is now at -75.89%.
- Its year over year revenue growth rate is now at -75.62%.
- Its 3 year price growth rate is now at 1.87%.

The table below shows DNLI's growth in key financial areas (numbers in millions of US dollars).
Date | Revenue | Operating Cash Flow | Net Income to Common Stock |
---|---|---|---|
2022-09-30 | 110.694 | -237.547 | -302.574 |
2022-06-30 | 112.42 | -221.935 | -283.863 |
2022-03-31 | 82.879 | -233.258 | -285.76 |
2021-12-31 | 48.661 | -211.389 | -290.581 |
2021-09-30 | 352.962 | 368.02 | 29.565 |
2021-06-30 | 357.07 | 409.54 | 55.925 |
DNLI's Quality Factors
The “Quality” component of the POWR Ratings focuses on 31 different factors of a companies fundamentals and operational strength. Here are some key insights as we drill into the specifics of these quality attributes.- DNLI has a Quality Grade of C, ranking ahead of 72.1% of graded US stocks.
- DNLI's asset turnover comes in at 0.231 -- ranking 185th of 682 Pharmaceutical Products stocks.
- 500 - Internal server error
The table below shows DNLI's key quality metrics over time.
Period | Asset Turnover | Gross Margin | ROIC |
---|---|---|---|
2021-09-30 | 0.231 | 1 | 0.028 |
2021-06-30 | 0.249 | 1 | 0.058 |
2021-03-31 | 0.279 | 1 | 0.069 |
2020-12-31 | 0.334 | 1 | 0.102 |
2020-09-30 | 0.032 | 1 | -0.411 |
2020-06-30 | 0.044 | 1 | -0.416 |
DNLI Price Target
For more insight on analysts targets of DNLI, see our DNLI price target page. And for a list of of all stocks sorted by upside potential based on analyst target price, see our Top Price Target page.
Average Price Target | $85.55 | Average Broker Recommendation | 1.5 (Moderate Buy) |
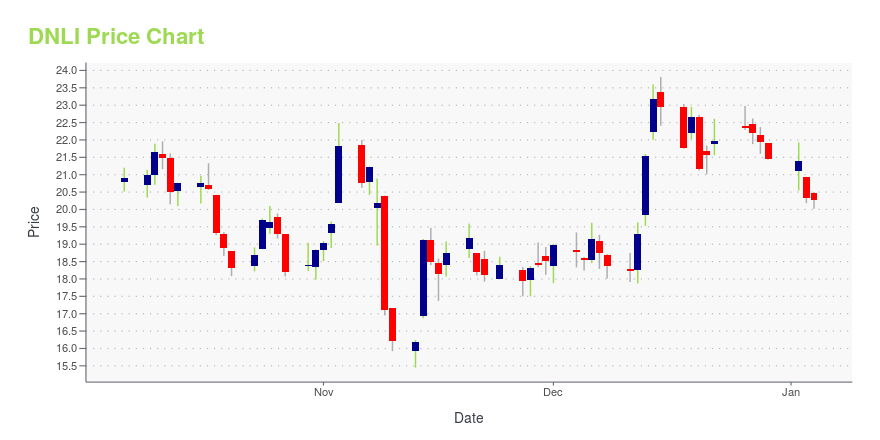
DNLI Stock Price Chart Interactive Chart >
DNLI Price/Volume Stats
Current price | $21.91 | 52-week high | $39.43 |
Prev. close | $23.09 | 52-week low | $20.24 |
Day low | $21.74 | Volume | 863,300 |
Day high | $23.54 | Avg. volume | 677,657 |
50-day MA | $27.34 | Dividend yield | N/A |
200-day MA | $29.81 | Market Cap | 2.99B |
Denali Therapeutics Inc. (DNLI) Company Bio
Denali Therapeutics Inc. engages in discovering and developing therapeutics for neurodegenerative diseases in the United States. The company’s lead LRRK2 product candidates includes the DNL201, a small molecule inhibitor that is in Phase I clinical trials, as well as DNL151, a small molecule inhibitor, which is in preclinical development stage for the treatment of Parkinson’s disease. It is also developing therapeutics for the treatment of Parkinson’s, dementia with Lewy bodies, and multiple system atrophy; amyotrophic lateral sclerosis; and mucopolysaccharidosis type II patients. The company was formerly known as SPR Pharma Inc. and changed its name to Denali Therapeutics Inc. in March 2015. Denali Therapeutics Inc. was founded in 2013 and is based in South San Francisco, California.
Latest DNLI News From Around the Web
Below are the latest news stories about DENALI THERAPEUTICS INC that investors may wish to consider to help them evaluate DNLI as an investment opportunity.
Why Is Denali Therapeutics Inc. (DNLI) Down 16% Since Last Earnings Report?Denali Therapeutics Inc. (DNLI) reported earnings 30 days ago. What's next for the stock? We take a look at earnings estimates for some clues. |
The Consensus EPS Estimates For Denali Therapeutics Inc. (NASDAQ:DNLI) Just Fell DramaticallyMarket forces rained on the parade of Denali Therapeutics Inc. ( NASDAQ:DNLI ) shareholders today, when the analysts... |
Denali (DNLI) Q4 Earnings Beat Estimates, Pipeline in FocusDenali (DNLI) reports better-than-expected results for the fourth quarter and full-year 2022, as it beats both earnings and revenue estimates. |
Denali Therapeutics Inc. (DNLI) Reports Q4 Loss, Tops Revenue EstimatesDenali Therapeutics Inc. (DNLI) delivered earnings and revenue surprises of 3.85% and 28.09%, respectively, for the quarter ended December 2022. Do the numbers hold clues to what lies ahead for the stock? |
Denali Therapeutics Reports Fourth Quarter and Full Year 2022 Financial Results and Business HighlightsSOUTH SAN FRANCISCO, Calif., Feb. 27, 2023 (GLOBE NEWSWIRE) -- Denali Therapeutics Inc. (Nasdaq: DNLI), a biopharmaceutical company developing a broad portfolio of product candidates engineered to cross the blood-brain barrier (BBB) for the treatment of neurodegenerative diseases and lysosomal storage diseases, today reported financial results for the fourth quarter and year ended December 31, 2022, and provided business highlights. “2022 was an important year for Denali, marked by transition to |
DNLI Price Returns
1-mo | -19.74% |
3-mo | -21.22% |
6-mo | -28.61% |
1-year | -31.89% |
3-year | 25.13% |
5-year | 11.27% |
YTD | -21.22% |
2022 | -37.65% |
2021 | -46.75% |
2020 | 380.83% |
2019 | -15.68% |
2018 | 32.10% |
Continue Researching DNLI
Here are a few links from around the web to help you further your research on Denali Therapeutics Inc's stock as an investment opportunity:Denali Therapeutics Inc (DNLI) Stock Price | Nasdaq
Denali Therapeutics Inc (DNLI) Stock Quote, History and News - Yahoo Finance
Denali Therapeutics Inc (DNLI) Stock Price and Basic Information | MarketWatch
Loading social stream, please wait...