Darden Restaurants Inc. (DRI): Price and Financial Metrics

Darden Restaurants Inc. (DRI): $172.87

0.91 (+0.53%)

POWR Rating

Component Grades

Momentum

C

Stability

C

Sentiment

Quality

C

Add DRI to Watchlist
Sign Up

Industry: Restaurants

Industry

D

Ranked

#23 of 42

in industry

DRI Price/Volume Stats

Current price $172.87 52-week high $176.84
Prev. close $171.96 52-week low $133.36
Day low $171.00 Volume 1,195,900
Day high $173.75 Avg. volume 1,044,255
50-day MA $166.06 Dividend yield 3.05%
200-day MA $158.81 Market Cap 20.64B

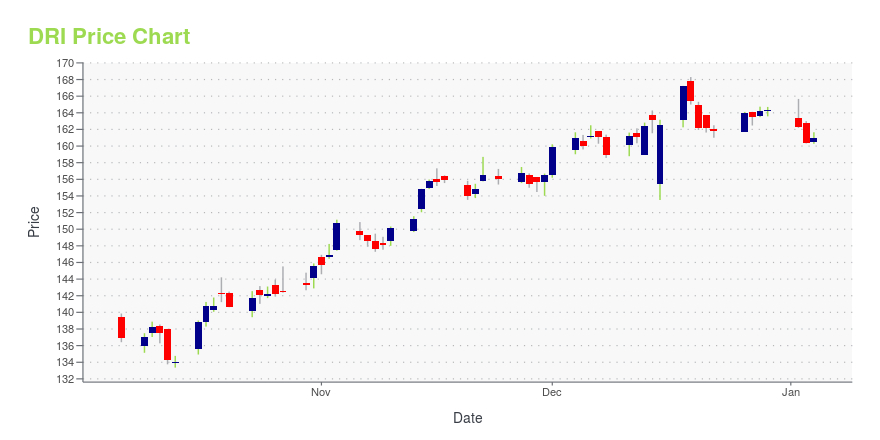
DRI Stock Price Chart Interactive Chart >

DRI POWR Grades

  • Stability is the dimension where DRI ranks best; there it ranks ahead of 77.43% of US stocks.
  • The strongest trend for DRI is in Quality, which has been heading down over the past 26 weeks.
  • DRI's current lowest rank is in the Growth metric (where it is better than 43.9% of US stocks).

DRI Stock Summary

  • DARDEN RESTAURANTS INC's market capitalization of $19,298,477,399 is ahead of 88.85% of US-listed equities.
  • The capital turnover (annual revenue relative to shareholder's equity) for DRI is 5.02 -- better than 90.76% of US stocks.
  • In terms of volatility of its share price, DRI is more volatile than merely 9.26% of stocks we're observing.
  • Stocks with similar financial metrics, market capitalization, and price volatility to DARDEN RESTAURANTS INC are H, CBOE, MOS, STKS, and KEX.
  • DRI's SEC filings can be seen here. And to visit DARDEN RESTAURANTS INC's official web site, go to www.darden.com.

DRI Valuation Summary

  • In comparison to the median Consumer Cyclical stock, DRI's price/sales ratio is 10% lower, now standing at 1.8.
  • Over the past 243 months, DRI's EV/EBIT ratio has gone up 10.3.

Below are key valuation metrics over time for DRI.

Stock Date P/S P/B P/E EV/EBIT
DRI 2023-12-29 1.8 9.2 20.1 20.7
DRI 2023-12-28 1.8 9.2 20.1 20.7
DRI 2023-12-27 1.8 9.2 20.0 20.6
DRI 2023-12-26 1.8 9.2 20.1 20.7
DRI 2023-12-22 1.8 9.1 19.8 20.5
DRI 2023-12-21 1.8 9.1 19.8 20.5

DRI Growth Metrics

    The 4 year revenue growth rate now stands at 24.77%.
  • Its 3 year cash and equivalents growth rate is now at 83.33%.
  • Its 3 year revenue growth rate is now at 10.59%.
Over the past 34 months, DRI's revenue has gone up $1,218,500,000.

The table below shows DRI's growth in key financial areas (numbers in millions of US dollars).

Date Revenue Operating Cash Flow Net Income to Common Stock
2022-12-31 9,984.4 1,410.7 908.9
2022-09-30 9,770.1 1,502.3 914.9
2022-06-30 9,630 1,256.1 952.8
2022-03-31 9,306.3 1,354.9 1,039.6
2021-12-31 8,590.4 1,243.8 921.3
2021-09-30 7,974.7 1,166.2 824.1

DRI's Quality Factors

The “Quality” component of the POWR Ratings focuses on 31 different factors of a companies fundamentals and operational strength. Here are some key insights as we drill into the specifics of these quality attributes.
  • DRI has a Quality Grade of B, ranking ahead of 81.54% of graded US stocks.
  • DRI's asset turnover comes in at 0.774 -- ranking 29th of 79 Restaraunts Hotels Motels stocks.
  • DENN, CAKE, and PLAY are the stocks whose asset turnover ratios are most correlated with DRI.

The table below shows DRI's key quality metrics over time.

Period Asset Turnover Gross Margin ROIC
2021-08-29 0.774 0.213 0.080
2021-05-30 0.711 0.208 0.059
2021-02-28 0.622 0.156 -0.025
2020-11-29 0.686 0.171 -0.013
2020-08-30 0.730 0.174 -0.024
2020-05-31 0.793 0.180 -0.010

DRI Price Target

For more insight on analysts targets of DRI, see our DRI price target page. And for a list of of all stocks sorted by upside potential based on analyst target price, see our Top Price Target page.

Average Price Target $161.64 Average Broker Recommendation 1.58 (Moderate Buy)

Darden Restaurants Inc. (DRI) Company Bio


Darden Restaurants, Inc. is an American multi-brand restaurant operator headquartered in Orlando. As of January 2022, the firm owns two fine dining restaurant chains: Eddie V's and The Capital Grille; and six casual dining restaurant chains: Olive Garden Italian RestaurantLongHorn SteakhouseBahama BreezeSeasons 52Yard House and Cheddar's Scratch Kitchen. Until July 28, 2014, Darden also owned Red Lobster. Darden has more than 1,800 restaurant locations and more than 175,000 employees, making it the world's largest full-service restaurant company. (Source:Wikipedia)


DRI Latest News Stream


Event/Time News Detail
Loading, please wait...

DRI Latest Social Stream


Loading social stream, please wait...

View Full DRI Social Stream

Latest DRI News From Around the Web

Below are the latest news stories about DARDEN RESTAURANTS INC that investors may wish to consider to help them evaluate DRI as an investment opportunity.

If You Like Dividends, You Should Love These 3 Stocks

These companies offer above-average dividend yields that should rise in the future.

Yahoo | December 23, 2023

25 Best Countries For Foodies To Travel

In this article, we take a look at the 25 best countries for foodies to travel. If you would like to skip our detailed analysis of the food service industry, you can directly go to 5 Best Countries For Foodies To Travel. Global Food Services Market: An Analysis Historically, nutritional research has mainly focused on […]

Yahoo | December 22, 2023

Insider Sell: SVP, Chief People Officer Sarah King Sells 4,286 Shares of Darden Restaurants Inc ...

Sarah King, SVP, Chief People Officer of Darden Restaurants Inc (NYSE:DRI), has sold 4,286 shares of the company on December 19, 2023, according to a recent SEC Filing.

Yahoo | December 22, 2023

High-Yield Darden Restaurants Bolstered by Strong Quarter, Projected EPS Growth

Restaurant stocks have enjoyed healthy gains in the last two months, and fundamentals look favorable for Darden

Yahoo | December 22, 2023

Insider Sell: President Melvin Martin Sells Shares of Darden Restaurants Inc

Melvin Martin, President of Darden Restaurants Inc (NYSE:DRI), executed a sale of 6,967 shares in the company on December 19, 2023, according to a recent SEC Filing.

Yahoo | December 21, 2023

Read More 'DRI' Stories Here

DRI Price Returns

1-mo 6.41%
3-mo 7.48%
6-mo 20.90%
1-year 18.65%
3-year 36.39%
5-year 70.04%
YTD 6.06%
2023 22.83%
2022 -4.82%
2021 29.48%
2020 10.45%
2019 12.29%

DRI Dividends

Ex-Dividend Date Type Payout Amount Change
Loading, please wait...
View Full DRI Dividend History

Get Free Updates

Join thousands of investors who get the latest news, insights and top rated picks from StockNews.com!