Dril-Quip, Inc. (DRQ): Price and Financial Metrics
DRQ Price/Volume Stats
Current price | $29.41 | 52-week high | $35.95 |
Prev. close | $28.06 | 52-week low | $19.25 |
Day low | $28.37 | Volume | 187,500 |
Day high | $29.51 | Avg. volume | 253,283 |
50-day MA | $27.62 | Dividend yield | N/A |
200-day MA | $27.19 | Market Cap | 1.01B |
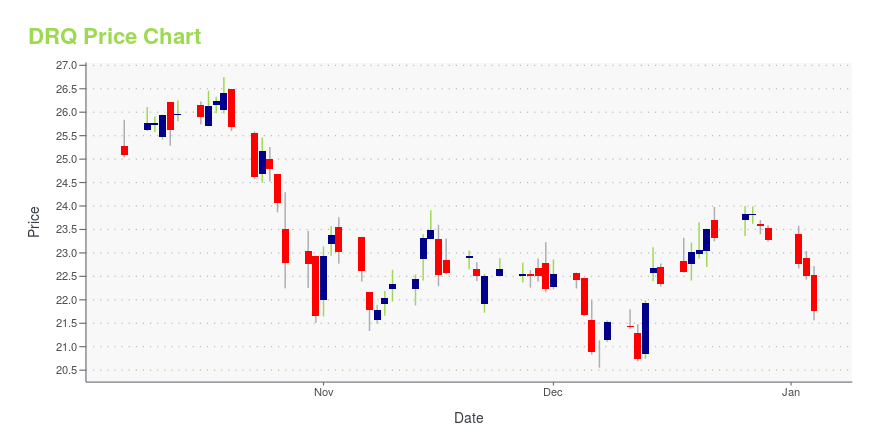
DRQ Stock Price Chart Interactive Chart >
DRQ POWR Grades
- DRQ scores best on the Momentum dimension, with a Momentum rank ahead of 99.08% of US stocks.
- The strongest trend for DRQ is in Stability, which has been heading up over the past 177 days.
- DRQ ranks lowest in Sentiment; there it ranks in the 5th percentile.
DRQ Stock Summary
- Of note is the ratio of DRIL-QUIP INC's sales and general administrative expense to its total operating expenses; 99% of US stocks have a lower such ratio.
- Equity multiplier, or assets relative to shareholders' equity, comes in at 1.11 for DRIL-QUIP INC; that's greater than it is for only 9.59% of US stocks.
- Over the past twelve months, DRQ has reported earnings growth of -131.43%, putting it ahead of just 10.76% of US stocks in our set.
- If you're looking for stocks that are quantitatively similar to DRIL-QUIP INC, a group of peers worth examining would be LPRO, STIM, SONM, SKYT, and SIBN.
- DRQ's SEC filings can be seen here. And to visit DRIL-QUIP INC's official web site, go to www.dril-quip.com.
DRQ Valuation Summary
- In comparison to the median Energy stock, DRQ's price/sales ratio is 92.86% higher, now standing at 2.7.
- Over the past 243 months, DRQ's price/sales ratio has gone up 1.3.
Below are key valuation metrics over time for DRQ.
Stock | Date | P/S | P/B | P/E | EV/EBIT |
---|---|---|---|---|---|
DRQ | 2023-09-14 | 2.7 | 1.1 | 48.2 | 28.2 |
DRQ | 2023-09-13 | 2.8 | 1.1 | 48.5 | 28.4 |
DRQ | 2023-09-12 | 2.9 | 1.2 | 50.3 | 29.8 |
DRQ | 2023-09-11 | 2.7 | 1.1 | 48.0 | 28.0 |
DRQ | 2023-09-08 | 2.7 | 1.1 | 48.1 | 28.1 |
DRQ | 2023-09-07 | 2.7 | 1.1 | 48.3 | 28.3 |
DRQ Growth Metrics
- Its 3 year price growth rate is now at -29.65%.
- Its 3 year cash and equivalents growth rate is now at -18.51%.
- Its 4 year price growth rate is now at -47.81%.

The table below shows DRQ's growth in key financial areas (numbers in millions of US dollars).
Date | Revenue | Operating Cash Flow | Net Income to Common Stock |
---|---|---|---|
2022-09-30 | 343.168 | -14.477 | -62.726 |
2022-06-30 | 338.024 | -6.196 | -89.079 |
2022-03-31 | 324.843 | 14.428 | -102.576 |
2021-12-31 | 322.945 | 38.428 | -127.996 |
2021-09-30 | 332.267 | 16.952 | -75.822 |
2021-06-30 | 340.565 | 21.518 | -50.353 |
DRQ's Quality Factors
The “Quality” component of the POWR Ratings focuses on 31 different factors of a companies fundamentals and operational strength. Here are some key insights as we drill into the specifics of these quality attributes.- DRQ has a Quality Grade of C, ranking ahead of 69.95% of graded US stocks.
- DRQ's asset turnover comes in at 0.296 -- ranking 99th of 104 Machinery stocks.
- BC, LII, and ACLS are the stocks whose asset turnover ratios are most correlated with DRQ.
The table below shows DRQ's key quality metrics over time.
Period | Asset Turnover | Gross Margin | ROIC |
---|---|---|---|
2021-09-30 | 0.296 | 0.262 | -0.100 |
2021-06-30 | 0.299 | 0.267 | -0.090 |
2021-03-31 | 0.306 | 0.272 | -0.077 |
2020-12-31 | 0.318 | 0.261 | -0.091 |
2020-09-30 | 0.332 | 0.272 | -0.063 |
2020-06-30 | 0.343 | 0.280 | -0.058 |
DRQ Price Target
For more insight on analysts targets of DRQ, see our DRQ price target page. And for a list of of all stocks sorted by upside potential based on analyst target price, see our Top Price Target page.
Average Price Target | $28.40 | Average Broker Recommendation | 1.88 (Hold) |
Dril-Quip, Inc. (DRQ) Company Bio
Dril-Quip Inc. designs, manufactures, sells, and services engineered offshore drilling and production equipment for use in deepwater, harsh environment, and severe service applications worldwide. The company was founded in 1981 and is based in Houston, Texas.
Latest DRQ News From Around the Web
Below are the latest news stories about DRIL-QUIP INC that investors may wish to consider to help them evaluate DRQ as an investment opportunity.
Calculating The Fair Value Of Dril-Quip, Inc. (NYSE:DRQ)Key Insights The projected fair value for Dril-Quip is US$28.06 based on 2 Stage Free Cash Flow to Equity Current share... |
Dril-Quip (DRQ) Up 0.6% Since Last Earnings Report: Can It Continue?Dril-Quip (DRQ) reported earnings 30 days ago. What's next for the stock? We take a look at earnings estimates for some clues. |
Dril-Quip, Inc. To Participate in the Barclays CEO Energy-Power ConferenceDril-Quip, Inc. (NYSE:DRQ), (the "Company" or "Dril-Quip"), announced today that Jeffrey Bird, Dril-Quip's President and Chief Executive Officer, will participate in a fireside chat at the Barclays CEO Energy-Power Conference in New York on Thursday, September 7 at 8:00 a.m. EDT. |
Here's Why Hold Strategy is Apt for Cenovus (CVE) Stock NowCenovus (CVE) continues to reduce debt through free fund flow generation and asset divestments. |
Baker Hughes (BKR) Teams up to Electrify Oil & Gas FacilitiesMarine Power Systems' partnership with Baker Hughes (BKR) will help decarbonize offshore operations for a sustainable energy future. |
DRQ Price Returns
1-mo | 7.77% |
3-mo | 26.39% |
6-mo | 2.51% |
1-year | 47.34% |
3-year | 20.63% |
5-year | -43.71% |
YTD | 8.24% |
2022 | 38.06% |
2021 | -33.56% |
2020 | -36.86% |
2019 | 56.21% |
2018 | -37.04% |
Continue Researching DRQ
Want to see what other sources are saying about Dril-Quip Inc's financials and stock price? Try the links below:Dril-Quip Inc (DRQ) Stock Price | Nasdaq
Dril-Quip Inc (DRQ) Stock Quote, History and News - Yahoo Finance
Dril-Quip Inc (DRQ) Stock Price and Basic Information | MarketWatch
Loading social stream, please wait...