Daseke, Inc. (DSKE): Price and Financial Metrics
DSKE Price/Volume Stats
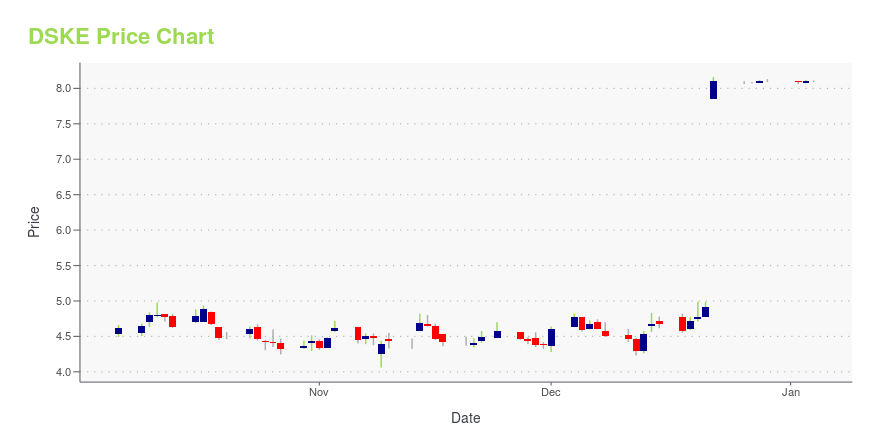
Current price | $8.27 | 52-week high | $8.34 |
Prev. close | $8.25 | 52-week low | $4.06 |
Day low | $8.27 | Volume | 189,000 |
Day high | $8.28 | Avg. volume | 762,202 |
50-day MA | $8.18 | Dividend yield | N/A |
200-day MA | $6.33 | Market Cap | 390.34M |
DSKE Stock Price Chart Interactive Chart >
DSKE POWR Grades
- DSKE scores best on the Value dimension, with a Value rank ahead of 86.55% of US stocks.
- DSKE's strongest trending metric is Growth; it's been moving down over the last 168 days.
- DSKE's current lowest rank is in the Growth metric (where it is better than 5.1% of US stocks).
DSKE Stock Summary
- DASEKE INC's capital turnover -- a measure of revenue relative to shareholder's equity -- is better than 95.8% of US listed stocks.
- DSKE's price/sales ratio is 0.23; that's higher than the P/S ratio of merely 6.85% of US stocks.
- DASEKE INC's shareholder yield -- a measure of how much capital is returned to stockholders via dividends and buybacks -- is 55.02%, greater than the shareholder yield of 96.92% of stocks in our set.
- Stocks that are quantitatively similar to DSKE, based on their financial statements, market capitalization, and price volatility, are ACEL, SP, TTEC, IP, and AP.
- Visit DSKE's SEC page to see the company's official filings. To visit the company's web site, go to www.belmonttrucking.com.
DSKE Valuation Summary
- DSKE's price/sales ratio is 0.2; this is 83.33% lower than that of the median Industrials stock.
- Over the past 100 months, DSKE's price/sales ratio has gone NA NA.
Below are key valuation metrics over time for DSKE.
Stock | Date | P/S | P/B | P/E | EV/EBIT |
---|---|---|---|---|---|
DSKE | 2023-12-29 | 0.2 | 2.1 | 53.8 | 14.3 |
DSKE | 2023-12-28 | 0.2 | 2.1 | 53.9 | 14.3 |
DSKE | 2023-12-27 | 0.2 | 2.1 | 53.7 | 14.2 |
DSKE | 2023-12-26 | 0.2 | 2.1 | 53.7 | 14.2 |
DSKE | 2023-12-22 | 0.2 | 2.1 | 53.8 | 14.3 |
DSKE | 2023-12-21 | 0.1 | 1.3 | 32.6 | 12.3 |
DSKE Growth Metrics
- Its year over year net cashflow from operations growth rate is now at -0.21%.
- Its 4 year revenue growth rate is now at 956.51%.
- Its 4 year net cashflow from operations growth rate is now at 27368.03%.
The table below shows DSKE's growth in key financial areas (numbers in millions of US dollars).
Date | Revenue | Operating Cash Flow | Net Income to Common Stock |
---|---|---|---|
2022-09-30 | 1,759.4 | 135.7 | 45.4 |
2022-06-30 | 1,721.2 | 138.5 | 53.8 |
2022-03-31 | 1,643.9 | 144.4 | 71.3 |
2021-12-31 | 1,556.8 | 144.7 | 51 |
2021-09-30 | 1,498.1 | 138.2 | 49.2 |
2021-06-30 | 1,449.3 | 120.1 | 44 |
DSKE's Quality Factors
The “Quality” component of the POWR Ratings focuses on 31 different factors of a companies fundamentals and operational strength. Here are some key insights as we drill into the specifics of these quality attributes.- DSKE has a Quality Grade of C, ranking ahead of 73.42% of graded US stocks.
- DSKE's asset turnover comes in at 1.371 -- ranking 20th of 137 Transportation stocks.
- HTLD, GOGL, and DAC are the stocks whose asset turnover ratios are most correlated with DSKE.
The table below shows DSKE's key quality metrics over time.
Period | Asset Turnover | Gross Margin | ROIC |
---|---|---|---|
2021-09-30 | 1.371 | 0.465 | 0.087 |
2021-06-30 | 1.307 | 0.475 | 0.081 |
2021-03-31 | 1.247 | 0.487 | 0.050 |
2020-12-31 | 1.271 | 0.486 | 0.039 |
2020-12-31 | 1.271 | 0.486 | 0.041 |
2020-09-30 | 1.326 | 0.475 | 0.027 |
DSKE Price Target
For more insight on analysts targets of DSKE, see our DSKE price target page. And for a list of of all stocks sorted by upside potential based on analyst target price, see our Top Price Target page.
Average Price Target | $11.00 | Average Broker Recommendation | 1.62 (Moderate Buy) |
Daseke, Inc. (DSKE) Company Bio
Daseke, Inc. provides open deck specialized transportation services in North America. It offers aerospace related transportation and flatbed trucking services with curtain trailers in flatbed, step-deck, and low -profile step-deck configuration; transformers, tower cranes, truck cranes, front end loaders, and dozer transportation services; oil field cargo and trucking logistics services; and specialty and over-dimensional flatbed cargo services, as well as carries oversized pre-stressed concrete and oversized mining tires. The company is based in Addison, Texas.
Latest DSKE News From Around the Web
Below are the latest news stories about DASEKE INC that investors may wish to consider to help them evaluate DSKE as an investment opportunity.
Should You Be Worried About Daseke, Inc.'s (NASDAQ:DSKE) 9.1% Return On Equity?While some investors are already well versed in financial metrics (hat tip), this article is for those who would like... |
TFI International Inc. (TFII) Surges 8.1%: Is This an Indication of Further Gains?TFI International Inc. (TFII) was a big mover last session on higher-than-average trading volume. The latest trend in earnings estimate revisions might not help the stock continue moving higher in the near term. |
Karuna downgraded, Arm target raised: Wall Street's top analyst callsKaruna downgraded, Arm target raised: Wall Street's top analyst calls |
Trucker TFI Is Buying Flatbed Heavyweight Daseke for About $386 MillionTFI International is buying trucking company Daseke in an all-cash deal for about $386 million that will make the company the largest operator by revenue of flatbed rigs targeting the construction industry. Montreal-based TFI will pay $8.30 a share for Daseke, a 69% premium to the closing stock price on Thursday, and will assume debt that will bring the total value of the deal to $1.1 billion. Based on an outstanding share count of about 46.5 million, the agreement values Addison, Texas-based Daseke at about $386 million. |
TFI buying Daseke for $1.1B, contemplating spinoff of truckload unitTFI International entered an agreement to acquire flatbed carrier Daseke and said it’s exploring a spinoff of its truckload business. The post TFI buying Daseke for $1.1B, contemplating spinoff of truckload unit appeared first on FreightWaves. |
DSKE Price Returns
1-mo | 0.49% |
3-mo | 73.01% |
6-mo | 62.16% |
1-year | 24.36% |
3-year | 11.46% |
5-year | 67.75% |
YTD | 2.10% |
2023 | 42.36% |
2022 | -43.33% |
2021 | 72.81% |
2020 | 83.86% |
2019 | -14.13% |
Continue Researching DSKE
Here are a few links from around the web to help you further your research on Daseke Inc's stock as an investment opportunity:Daseke Inc (DSKE) Stock Price | Nasdaq
Daseke Inc (DSKE) Stock Quote, History and News - Yahoo Finance
Daseke Inc (DSKE) Stock Price and Basic Information | MarketWatch
Loading social stream, please wait...