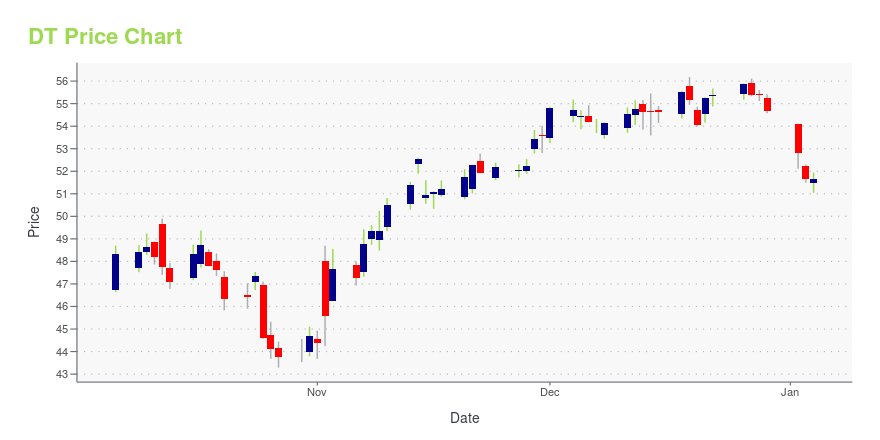
Dynatrace Inc. (DT): Price and Financial Metrics
DT Price/Volume Stats
| Current price | $44.30 | 52-week high | $61.41 |
| Prev. close | $43.73 | 52-week low | $42.31 |
| Day low | $43.73 | Volume | 2,049,756 |
| Day high | $44.43 | Avg. volume | 3,554,683 |
| 50-day MA | $45.29 | Dividend yield | N/A |
| 200-day MA | $49.09 | Market Cap | 13.21B |
DT Stock Price Chart Interactive Chart >
Dynatrace Inc. (DT) Company Bio
Dynatrace, Inc. is a global technology company listed on the NYSE that provides a software intelligence platform based on artificial intelligence (AI) and automation. Dynatrace technologies are used to monitor and optimize application performance, software development and security practices, IT infrastructure, and user experience for businesses and government agencies throughout the world. (Source:Wikipedia)
Latest DT News From Around the Web
Below are the latest news stories about DYNATRACE INC that investors may wish to consider to help them evaluate DT as an investment opportunity.
Dow Jones Giants Apple, Microsoft Lead Five Stocks Near Buy PointsApple and Microsoft are among stocks trading right around buy points as the market rally refuses to pause. |
Dynatrace (DT) Outperforms Broader Market: What You Need to KnowDynatrace (DT) closed the most recent trading day at $55.37, moving +0.25% from the previous trading session. |
Dynatrace Stock In Buy Zone After Reaching HighsDT stock gained around 43% this year so far. Dynatrace uses a three-pronged approach in its artificial intelligence technologies. |
Dynatrace Inc SVP, CFO and Treasurer James Benson Sells 35,996 SharesJames Benson, SVP, CFO and Treasurer of Dynatrace Inc (NYSE:DT), executed a sale of 35,996 shares in the company on December 18, 2023, according to a recent SEC Filing. |
Dynatrace, Inc.'s (NYSE:DT) P/S Still Appears To Be ReasonableDynatrace, Inc.'s ( NYSE:DT ) price-to-sales (or "P/S") ratio of 12.4x might make it look like a strong sell right now... |
DT Price Returns
| 1-mo | 1.26% |
| 3-mo | -5.94% |
| 6-mo | -23.96% |
| 1-year | -18.21% |
| 3-year | -29.11% |
| 5-year | N/A |
| YTD | -19.00% |
| 2023 | 42.79% |
| 2022 | -36.54% |
| 2021 | 39.47% |
| 2020 | 71.03% |
| 2019 | N/A |


Loading social stream, please wait...