
Duos Technologies Group Inc. (DUOT): Price and Financial Metrics
DUOT Price/Volume Stats
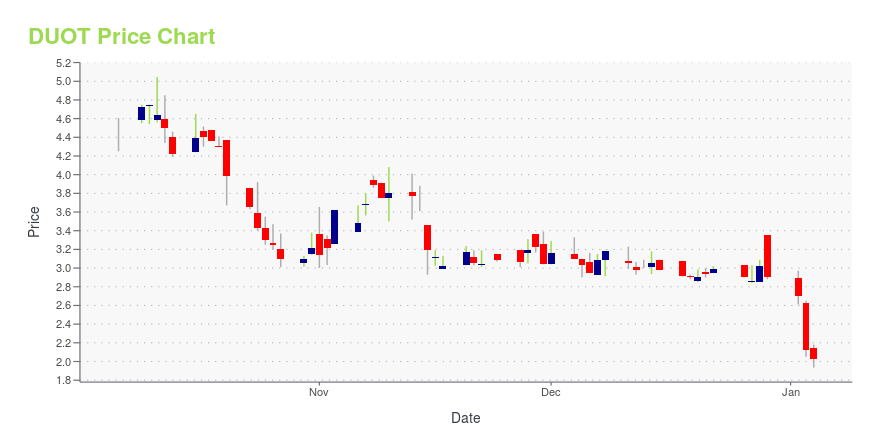
| Current price | $3.20 | 52-week high | $6.74 |
| Prev. close | $3.03 | 52-week low | $1.93 |
| Day low | $2.90 | Volume | 52,400 |
| Day high | $3.20 | Avg. volume | 36,243 |
| 50-day MA | $2.71 | Dividend yield | N/A |
| 200-day MA | $3.31 | Market Cap | 24.10M |
DUOT Stock Price Chart Interactive Chart >
Duos Technologies Group Inc. (DUOT) Company Bio
Duos Technologies provides a broad range of sophisticated intelligent technology solutions with an emphasis on mission critical applications. Based in Jacksonville, FL, duostech services customers throughout North America, integrating safety, security, situational awareness and automation platforms in all types of environments.
Latest DUOT News From Around the Web
Below are the latest news stories about DUOS TECHNOLOGIES GROUP INC that investors may wish to consider to help them evaluate DUOT as an investment opportunity.
Market Sentiment Around Loss-Making Duos Technologies Group, Inc. (NASDAQ:DUOT)With the business potentially at an important milestone, we thought we'd take a closer look at Duos Technologies Group... |
Duos Technologies Group Reports Third Quarter 2023 ResultsDuos Technologies Group Reports Third Quarter 2023 Results Duos Technologies Group Reports Third Quarter 2023 Results JACKSONVILLE, Fla., Nov. 14, 2023 (GLOBE NEWSWIRE) -- Duos Technologies Group, Inc. (“Duos” or the “Company”) (Nasdaq: DUOT), a provider of machine vision and artificial intelligence that analyzes fast moving vehicles, reported financial results for the third quarter (“Q3 2023”) ended September 30, 2023. Third Quarter 2023 and Recent Operational Highlights Implemented first subsc |
Duos Technologies Group Sets Third Quarter 2023 Earnings Call for Tuesday, November 14, 2023 at 4:30 PM ETDuos Technologies Group Sets Third Quarter 2023 Earnings Call for Tuesday, November 14, 2023 at 4:30 PM ET Duos Technologies Group Sets Third Quarter 2023 Earnings Call for Tuesday, November 14, 2023 at 4:30 PM ET JACKSONVILLE, Fla., Oct. 31, 2023 (GLOBE NEWSWIRE) -- Duos Technologies Group, Inc. (“Duos” or the “Company”) (Nasdaq: DUOT), through its operating subsidiary Duos Technologies, Inc., a provider of machine vision and artificial intelligence that analyzes fast moving vehicles, will hold |
Duos Technologies to Present at Railway Interchange 2023 Conference on October 3, 2023Presentation Explores the Synergy of AI, Rail Technology, and Human Expertise in the Rail Industry Duos Technologies to Present at Railway Interchange 2023 Conference on October 3, 2023 Duos Technologies to Present at Railway Interchange 2023 Conference on October 3, 2023Presentation Explores the Synergy of AI, Rail Technology, and Human Expertise in the Rail Industry JACKSONVILLE, Fla., Sept. 27, 2023 (GLOBE NEWSWIRE) -- Duos Technologies Group, Inc. (“Duos” or the “Company”) (Nasdaq: DUOT), th |
GSAC Engineering Acquires Key Intellectual Property and Assets from Duos Technologies GroupGelStat’s Subsidiary, GSAC Engineering, Launches Intelligent Correctional Facilities Automation Systems (iCAS) in the Industrial Security MarketMIAMI, Sept. 12, 2023 (GLOBE NEWSWIRE) -- GelStat Corporation ("GelStat" or the "Company") (OTCPink: GSAC), a development stage company currently focused on the research, development, and marketing of engineered solutions for the industrial security and clean energy industries, today announced that its recently formed subsidiary, GSAC Engineering (“GSACe |
DUOT Price Returns
| 1-mo | 21.67% |
| 3-mo | 0.63% |
| 6-mo | -27.60% |
| 1-year | -48.05% |
| 3-year | -61.39% |
| 5-year | -61.90% |
| YTD | 10.34% |
| 2023 | 45.00% |
| 2022 | -61.01% |
| 2021 | 20.99% |
| 2020 | -36.69% |
| 2019 | -4.32% |
Loading social stream, please wait...