DaVita Inc. (DVA): Price and Financial Metrics
DVA Price/Volume Stats
Current price | $137.32 | 52-week high | $141.54 |
Prev. close | $136.85 | 52-week low | $71.51 |
Day low | $136.96 | Volume | 71,856 |
Day high | $138.08 | Avg. volume | 886,957 |
50-day MA | $122.71 | Dividend yield | N/A |
200-day MA | $104.18 | Market Cap | 12.04B |
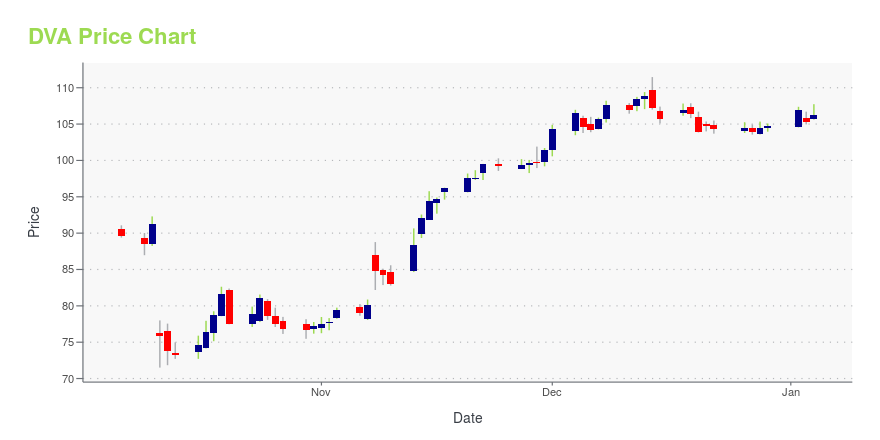
DVA Stock Price Chart Interactive Chart >
DVA POWR Grades
- Growth is the dimension where DVA ranks best; there it ranks ahead of 96.14% of US stocks.
- The strongest trend for DVA is in Stability, which has been heading down over the past 26 weeks.
- DVA ranks lowest in Momentum; there it ranks in the 26th percentile.
DVA Stock Summary
- The capital turnover (annual revenue relative to shareholder's equity) for DVA is 9.93 -- better than 96.2% of US stocks.
- The ratio of debt to operating expenses for DAVITA INC is higher than it is for about 82.5% of US stocks.
- Equity multiplier, or assets relative to shareholders' equity, comes in at 17.99 for DAVITA INC; that's greater than it is for 97.37% of US stocks.
- If you're looking for stocks that are quantitatively similar to DAVITA INC, a group of peers worth examining would be APA, CFBK, QRTEA, BKU, and LARK.
- DVA's SEC filings can be seen here. And to visit DAVITA INC's official web site, go to www.davita.com.
DVA Valuation Summary
- In comparison to the median Healthcare stock, DVA's price/sales ratio is 80.95% lower, now standing at 0.8.
- DVA's price/earnings ratio has moved up 1.1 over the prior 243 months.
Below are key valuation metrics over time for DVA.
Stock | Date | P/S | P/B | P/E | EV/EBIT |
---|---|---|---|---|---|
DVA | 2023-12-29 | 0.8 | 8.0 | 15.7 | 16.7 |
DVA | 2023-12-28 | 0.8 | 8.0 | 15.7 | 16.7 |
DVA | 2023-12-27 | 0.8 | 7.9 | 15.6 | 16.6 |
DVA | 2023-12-26 | 0.8 | 8.0 | 15.7 | 16.7 |
DVA | 2023-12-22 | 0.8 | 7.9 | 15.6 | 16.6 |
DVA | 2023-12-21 | 0.8 | 8.0 | 15.7 | 16.7 |
DVA Growth Metrics
- The year over year net cashflow from operations growth rate now stands at 18.38%.
- The 5 year cash and equivalents growth rate now stands at 1.1%.
- The 3 year revenue growth rate now stands at 2.81%.
The table below shows DVA's growth in key financial areas (numbers in millions of US dollars).
Date | Revenue | Operating Cash Flow | Net Income to Common Stock |
---|---|---|---|
2022-09-30 | 11,636.97 | 1,750.736 | 679.77 |
2022-06-30 | 11,626.6 | 1,607.156 | 834.158 |
2022-03-31 | 11,616.35 | 2,098.767 | 903.169 |
2021-12-31 | 11,618.8 | 1,930.876 | 978.45 |
2021-09-30 | 11,580.15 | 1,885.786 | 964.75 |
2021-06-30 | 11,565.9 | 1,801.561 | 863.67 |
DVA's Quality Factors
The “Quality” component of the POWR Ratings focuses on 31 different factors of a companies fundamentals and operational strength. Here are some key insights as we drill into the specifics of these quality attributes.- DVA has a Quality Grade of B, ranking ahead of 81.19% of graded US stocks.
- DVA's asset turnover comes in at 0.661 -- ranking 45th of 81 Healthcare stocks.
- LHCG, NTRA, and CHE are the stocks whose asset turnover ratios are most correlated with DVA.
The table below shows DVA's key quality metrics over time.
Period | Asset Turnover | Gross Margin | ROIC |
---|---|---|---|
2021-09-30 | 0.661 | 0.312 | 0.082 |
2021-06-30 | 0.666 | 0.314 | 0.078 |
2021-03-31 | 0.650 | 0.310 | 0.074 |
2020-12-31 | 0.651 | 0.308 | 0.077 |
2020-09-30 | 0.648 | 0.313 | 0.083 |
2020-06-30 | 0.643 | 0.310 | 0.082 |
DVA Price Target
For more insight on analysts targets of DVA, see our DVA price target page. And for a list of of all stocks sorted by upside potential based on analyst target price, see our Top Price Target page.
Average Price Target | $143.11 | Average Broker Recommendation | 2 (Hold) |
DaVita Inc. (DVA) Company Bio
DaVita Inc. provides kidney dialysis services through a network of 2,816 outpatient dialysis centers in the United States, serving 204,200 patients, and 321 outpatient dialysis centers in 10 other countries serving 3,200 patients. The company primarily treats end-stage renal disease (ESRD), which requires patients to undergo dialysis 3 times per week for the rest of their lives unless they receive a donor kidney. The company has a 37% market share in the U.S. dialysis market. It is organized in Delaware and based in Denver. (Source:Wikipedia)
Latest DVA News From Around the Web
Below are the latest news stories about DAVITA INC that investors may wish to consider to help them evaluate DVA as an investment opportunity.
Brookdale (BKD) Concludes Transactions to Extend Debt RepaymentBrookdale (BKD) completes two financing transactions to push its debt maturities until September 2025, thereby relieving it from the debt repayment burden for next year and focusing on core operations. |
3 Reasons to Hold Zimmer Biomet (ZBH) Stock in Your PortfolioZimmer Biomet's (ZBH) focus on emerging markets raises optimism about the stock. |
Three Reasons to Add Ecolab (ECL) Stock to Your PortfolioEcolab's (ECL) focus on R&D raises optimism about the stock. |
The Zacks Analyst Blog Highlights DaVita, GE HealthCare Technologies and HologicDaVita, GE HealthCare Technologies and Hologic are part of the Zacks top Analyst Blog. |
DVA vs. CHE: Which Stock Is the Better Value Option?DVA vs. CHE: Which Stock Is the Better Value Option? |
DVA Price Returns
1-mo | 7.62% |
3-mo | 31.08% |
6-mo | 45.27% |
1-year | 75.00% |
3-year | 24.78% |
5-year | 152.94% |
YTD | 31.08% |
2023 | 40.30% |
2022 | -34.36% |
2021 | -3.10% |
2020 | 56.47% |
2019 | 45.80% |
Continue Researching DVA
Want to do more research on Davita Inc's stock and its price? Try the links below:Davita Inc (DVA) Stock Price | Nasdaq
Davita Inc (DVA) Stock Quote, History and News - Yahoo Finance
Davita Inc (DVA) Stock Price and Basic Information | MarketWatch
Loading social stream, please wait...