
DexCom Inc. (DXCM): Price and Financial Metrics
DXCM Price/Volume Stats
| Current price | $64.00 | 52-week high | $142.00 |
| Prev. close | $107.85 | 52-week low | $62.34 |
| Day low | $62.34 | Volume | 53,888,875 |
| Day high | $67.44 | Avg. volume | 3,277,703 |
| 50-day MA | $116.04 | Dividend yield | N/A |
| 200-day MA | $118.14 | Market Cap | 25.45B |
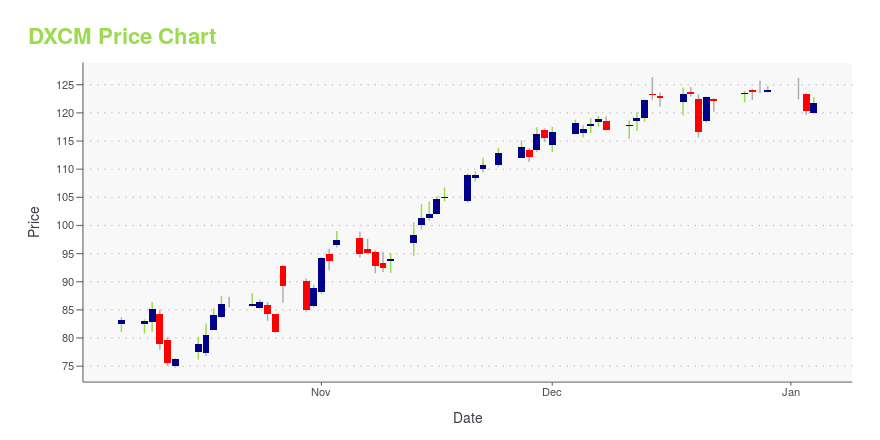
DXCM Stock Price Chart Interactive Chart >
DexCom Inc. (DXCM) Company Bio
Dexcom was founded in 1999 by Scott Glenn, John Burd, Lauren Otsuki, Ellen Preston and Bret Megargel. In 2006, Dexcom received U.S. Food and Drug Administration (FDA) approval and launched the Dexcom STS Continuous Glucose Monitoring System, which is a three-day sensor that provides up to 288 glucose measurements for every 24 hours. Dexcom received approval of the second generation product, the Seven Continuous Glucose Monitoring System in May 2007. This device improved on accuracy and extended use from three to seven days. In 2008, Dexcom announced two consumer development agreements with Insulet Corporation and Animas Corporation as well as a development agreement with Edwards Lifesciences for a continuous glucose monitor in the intensive care unit hospital environment. (Source:Wikipedia)
Latest DXCM News From Around the Web
Below are the latest news stories about DEXCOM INC that investors may wish to consider to help them evaluate DXCM as an investment opportunity.
3 Medical-Device Stocks Could Click in 2024Baird is bullish on Boston Scientific, Insulet, and DexCom, stocks set to benefit as those companies ramp up sales. |
5 MedTech Stocks Poised to Continue Their Winning Streaks in 2024Stocks like DexCom Inc. (DXCM), Integer Holdings (ITGR), Penumbra (PEN), Haemonetics (HAE), Health Equity (HAE) and are likely to continue their strong performance in 2024. |
Calculating The Fair Value Of DexCom, Inc. (NASDAQ:DXCM)Key Insights Using the 2 Stage Free Cash Flow to Equity, DexCom fair value estimate is US$117 Current share price of... |
DexCom (DXCM) Stock Falls Amid Market Uptick: What Investors Need to KnowIn the closing of the recent trading day, DexCom (DXCM) stood at $122.17, denoting a -0.51% change from the preceding trading day. |
3 Reasons Why Growth Investors Shouldn't Overlook DexCom (DXCM)DexCom (DXCM) is well positioned to outperform the market, as it exhibits above-average growth in financials. |
DXCM Price Returns
| 1-mo | -43.62% |
| 3-mo | -48.53% |
| 6-mo | -47.52% |
| 1-year | -50.53% |
| 3-year | -42.93% |
| 5-year | 66.48% |
| YTD | -48.42% |
| 2023 | 9.58% |
| 2022 | -15.64% |
| 2021 | 45.23% |
| 2020 | 69.02% |
| 2019 | 82.59% |
Continue Researching DXCM
Want to do more research on Dexcom Inc's stock and its price? Try the links below:Dexcom Inc (DXCM) Stock Price | Nasdaq
Dexcom Inc (DXCM) Stock Quote, History and News - Yahoo Finance
Dexcom Inc (DXCM) Stock Price and Basic Information | MarketWatch
Loading social stream, please wait...