
DXP Enterprises, Inc. (DXPE): Price and Financial Metrics
DXPE Price/Volume Stats
| Current price | $53.22 | 52-week high | $57.38 |
| Prev. close | $51.78 | 52-week low | $28.70 |
| Day low | $52.37 | Volume | 100,296 |
| Day high | $53.59 | Avg. volume | 106,285 |
| 50-day MA | $48.38 | Dividend yield | N/A |
| 200-day MA | $41.20 | Market Cap | 847.69M |
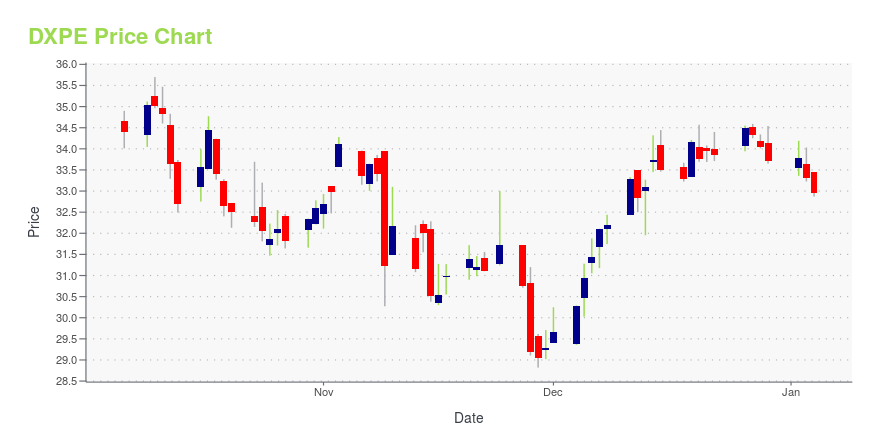
DXPE Stock Price Chart Interactive Chart >
DXP Enterprises, Inc. (DXPE) Company Bio
DXP Enterprises, Inc. engages in distributing maintenance, repair, and operating (MRO) products, equipment, and services to industrial customers in the United States. It operates through three segments: Service Centers, Supply Chain Services, and Innovative Pumping Solutions. The company was founded in 1908 and is based in Houston, Texas.
Latest DXPE News From Around the Web
Below are the latest news stories about DXP ENTERPRISES INC that investors may wish to consider to help them evaluate DXPE as an investment opportunity.
DXP Enterprises, Inc. (NASDAQ:DXPE) Q3 2023 Earnings Call TranscriptDXP Enterprises, Inc. (NASDAQ:DXPE) Q3 2023 Earnings Call Transcript November 10, 2023 Operator: Good morning. My name is Krista, and I’ll be your conference operator today. At this time, I would like to welcome everyone to the DXP Enterprises Third Quarter Earnings Conference Call. All lines have been placed on mute to prevent any background […] |
Q3 2023 DXP Enterprises Inc Earnings CallQ3 2023 DXP Enterprises Inc Earnings Call |
DXP Enterprises Inc (DXPE) Reports Strong Earnings Growth and Robust Free Cash Flow in Q3 2023DXPE Achieves Significant Year-Over-Year Sales and Earnings Per Share Increase |
DXP Enterprises, Inc. Reports Third Quarter 2023 ResultsHOUSTON, November 08, 2023--DXP Enterprises, Inc. (the "Company" or "DXPE") (NASDAQ: DXPE) today announced financial results for the third quarter ended September 30, 2023. The following are results for the three months ended September 30, 2023, compared to the three months ended September 30, 2022, and for the three months ended June 30, 2023, where appropriate. A reconciliation of the non-GAAP financial measures can be found in the back of this press release. |
DXP Sets Date for 2023 Third Quarter Earnings Release and Conference CallHOUSTON, November 06, 2023--DXP Enterprises, Inc. (NASDAQ:DXPE), a leading products and service distributor that adds value and total cost savings solutions to MRO and OEM customers in virtually every industry, plans to issue a press release announcing its financial results for the third quarter ended September 30, 2023, on Thursday, November 9th. The earnings announcement will be released before the market opens. DXP will host a conference call, to be web cast live, on the Company’s website (ww |
DXPE Price Returns
| 1-mo | 15.62% |
| 3-mo | 4.56% |
| 6-mo | 61.22% |
| 1-year | 42.34% |
| 3-year | 64.41% |
| 5-year | 63.20% |
| YTD | 57.92% |
| 2023 | 22.32% |
| 2022 | 7.32% |
| 2021 | 15.47% |
| 2020 | -44.16% |
| 2019 | 43.00% |
Continue Researching DXPE
Want to see what other sources are saying about Dxp Enterprises Inc's financials and stock price? Try the links below:Dxp Enterprises Inc (DXPE) Stock Price | Nasdaq
Dxp Enterprises Inc (DXPE) Stock Quote, History and News - Yahoo Finance
Dxp Enterprises Inc (DXPE) Stock Price and Basic Information | MarketWatch
Loading social stream, please wait...