
GrafTech International Ltd. (EAF): Price and Financial Metrics
EAF Price/Volume Stats
| Current price | $0.80 | 52-week high | $5.32 |
| Prev. close | $0.84 | 52-week low | $0.79 |
| Day low | $0.79 | Volume | 6,980,120 |
| Day high | $1.07 | Avg. volume | 3,489,802 |
| 50-day MA | $1.27 | Dividend yield | N/A |
| 200-day MA | $1.84 | Market Cap | 206.56M |
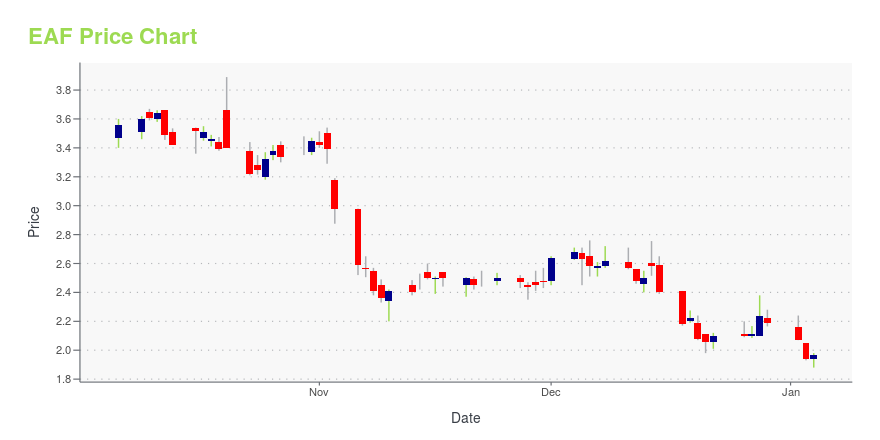
EAF Stock Price Chart Interactive Chart >
GrafTech International Ltd. (EAF) Company Bio
GrafTech International Ltd. researches, develops, manufactures, and sells synthetic and natural graphite and carbon based products worldwide. It offers graphite electrodes, which are components of the conductive power systems used to produce steel and non-ferrous metals; and petroleum needle coke, a crystalline form of carbon used in the production of graphite electrodes. The company was founded in 1886 and is based in Independence, Ohio. GrafTech International Ltd. is a subsidiary of BCP IV GrafTech Holdings LP.
Latest EAF News From Around the Web
Below are the latest news stories about GRAFTECH INTERNATIONAL LTD that investors may wish to consider to help them evaluate EAF as an investment opportunity.
Institutional owners may consider drastic measures as GrafTech International Ltd.'s (NYSE:EAF) recent US$100m drop adds to long-term lossesKey Insights Given the large stake in the stock by institutions, GrafTech International's stock price might be... |
GrafTech Announces Increased Public Float through Consortium Stock Distribution and Board ResignationBROOKLYN HEIGHTS, Ohio, December 14, 2023--GrafTech International Ltd. (NYSE: EAF) ("GrafTech" or the "Company") today announced that its 25% shareholder, Brookfield Business Partners LP and its affiliates (together, "Brookfield"), distributed all 63.8 million of their shares of GrafTech common stock to a consortium of investors, which includes affiliates of Brookfield as well as un-affiliated investors. |
GrafTech International (NYSE:EAF) investors are sitting on a loss of 83% if they invested five years agoLong term investing works well, but it doesn't always work for each individual stock. It hits us in the gut when we see... |
GrafTech International Ltd. (NYSE:EAF) Analysts Are Way More Bearish Than They Used To BeToday is shaping up negative for GrafTech International Ltd. ( NYSE:EAF ) shareholders, with the analysts delivering a... |
GrafTech International Ltd. (NYSE:EAF) Q3 2023 Earnings Call TranscriptGrafTech International Ltd. (NYSE:EAF) Q3 2023 Earnings Call Transcript November 3, 2023 GrafTech International Ltd. misses on earnings expectations. Reported EPS is $-0.08 EPS, expectations were $-0.05. Operator: Good morning, ladies and gentlemen, and welcome to the GrafTech Third Quarter 2023 Earnings Conference Call and Webcast. At this time, all lines are in a listen-only […] |
EAF Price Returns
| 1-mo | -22.33% |
| 3-mo | -49.37% |
| 6-mo | -47.71% |
| 1-year | -84.10% |
| 3-year | -92.81% |
| 5-year | -92.67% |
| YTD | -63.47% |
| 2023 | -53.81% |
| 2022 | -59.53% |
| 2021 | 11.34% |
| 2020 | -6.94% |
| 2019 | 4.40% |
Continue Researching EAF
Want to do more research on Graftech International Ltd's stock and its price? Try the links below:Graftech International Ltd (EAF) Stock Price | Nasdaq
Graftech International Ltd (EAF) Stock Quote, History and News - Yahoo Finance
Graftech International Ltd (EAF) Stock Price and Basic Information | MarketWatch
Loading social stream, please wait...