Brinker International, Inc. (EAT): Price and Financial Metrics
EAT Price/Volume Stats
Current price | $30.42 | 52-week high | $42.12 |
Prev. close | $29.75 | 52-week low | $23.94 |
Day low | $29.34 | Volume | 473,875 |
Day high | $30.43 | Avg. volume | 1,026,224 |
50-day MA | $33.83 | Dividend yield | N/A |
200-day MA | $36.56 | Market Cap | 1.36B |
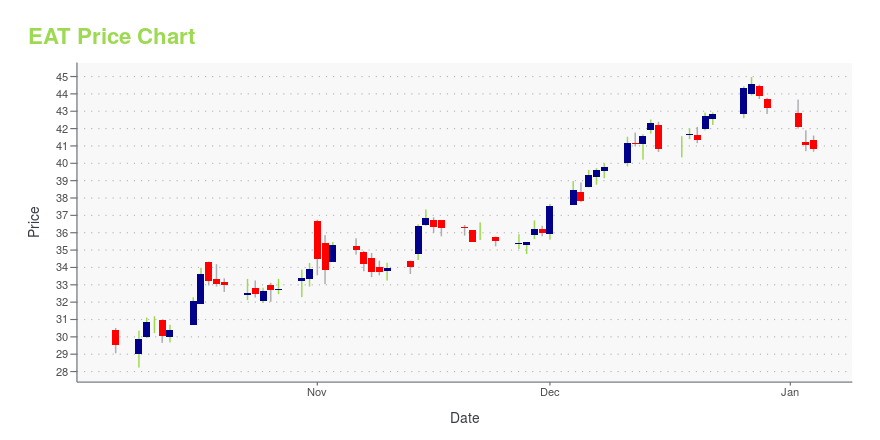
EAT Stock Price Chart Interactive Chart >
EAT POWR Grades
- EAT scores best on the Value dimension, with a Value rank ahead of 90.1% of US stocks.
- EAT's strongest trending metric is Sentiment; it's been moving down over the last 177 days.
- EAT's current lowest rank is in the Sentiment metric (where it is better than 4.28% of US stocks).
EAT Stock Summary
- BRINKER INTERNATIONAL INC's capital turnover -- a measure of revenue relative to shareholder's equity -- is better than only 0.72% of US listed stocks.
- BRINKER INTERNATIONAL INC's stock had its IPO on July 28, 1989, making it an older stock than 89.19% of US equities in our set.
- Equity multiplier, or assets relative to shareholders' equity, comes in at -10.86 for BRINKER INTERNATIONAL INC; that's greater than it is for only 2.15% of US stocks.
- Stocks with similar financial metrics, market capitalization, and price volatility to BRINKER INTERNATIONAL INC are ESEA, DBRG, RM, OUT, and AR.
- Visit EAT's SEC page to see the company's official filings. To visit the company's web site, go to www.brinker.com.
EAT Valuation Summary
- In comparison to the median Consumer Cyclical stock, EAT's price/earnings ratio is 8% lower, now standing at 13.8.
- Over the past 243 months, EAT's EV/EBIT ratio has gone up 10.7.
Below are key valuation metrics over time for EAT.
Stock | Date | P/S | P/B | P/E | EV/EBIT |
---|---|---|---|---|---|
EAT | 2023-09-13 | 0.3 | -9.8 | 13.8 | 24.4 |
EAT | 2023-09-12 | 0.3 | -9.7 | 13.6 | 24.2 |
EAT | 2023-09-11 | 0.3 | -9.4 | 13.3 | 24.0 |
EAT | 2023-09-08 | 0.3 | -9.6 | 13.5 | 24.2 |
EAT | 2023-09-07 | 0.3 | -9.7 | 13.6 | 24.2 |
EAT | 2023-09-06 | 0.3 | -9.5 | 13.3 | 24.0 |
EAT Growth Metrics
- The year over year net income to common stockholders growth rate now stands at 1959.46%.
- The 4 year price growth rate now stands at -42.84%.
- The 2 year revenue growth rate now stands at 13.19%.

The table below shows EAT's growth in key financial areas (numbers in millions of US dollars).
Date | Revenue | Operating Cash Flow | Net Income to Common Stock |
---|---|---|---|
2022-12-31 | 3,976.4 | 212.8 | 74.5 |
2022-09-30 | 3,883.2 | 236.6 | 74.2 |
2022-06-30 | 3,804.1 | 252.2 | 117.6 |
2022-03-31 | 3,791.2 | 312.7 | 152.4 |
2021-12-31 | 3,639.2 | 347.1 | 149.7 |
2021-09-30 | 3,474.1 | 327.1 | 134.1 |
EAT's Quality Factors
The “Quality” component of the POWR Ratings focuses on 31 different factors of a companies fundamentals and operational strength. Here are some key insights as we drill into the specifics of these quality attributes.- EAT has a Quality Grade of B, ranking ahead of 84.34% of graded US stocks.
- EAT's asset turnover comes in at 1.439 -- ranking 2nd of 79 Restaraunts Hotels Motels stocks.
- DENN, CBRL, and DRI are the stocks whose asset turnover ratios are most correlated with EAT.
The table below shows EAT's key quality metrics over time.
Period | Asset Turnover | Gross Margin | ROIC |
---|---|---|---|
2021-06-30 | 1.439 | 0.151 | 0.054 |
2021-03-24 | 1.236 | 0.126 | 0.012 |
2020-12-23 | 1.214 | 0.124 | 0.009 |
2020-09-23 | 1.240 | 0.131 | 0.014 |
2020-06-24 | 1.239 | 0.133 | 0.015 |
2020-03-25 | 1.516 | 0.153 | 0.049 |
EAT Price Target
For more insight on analysts targets of EAT, see our EAT price target page. And for a list of of all stocks sorted by upside potential based on analyst target price, see our Top Price Target page.
Average Price Target | $67.66 | Average Broker Recommendation | 1.62 (Moderate Buy) |
Brinker International, Inc. (EAT) Company Bio
Brinker International owns, develops, operates, and franchises casual dining restaurants worldwide under the Chili's Grill & Bar brand and Maggiano's Little Italy name. The company was founded in 1975 and is based in Dallas, Texas.
Latest EAT News From Around the Web
Below are the latest news stories about BRINKER INTERNATIONAL INC that investors may wish to consider to help them evaluate EAT as an investment opportunity.
There Are Reasons To Feel Uneasy About Brinker International's (NYSE:EAT) Returns On CapitalDid you know there are some financial metrics that can provide clues of a potential multi-bagger? Amongst other things... |
Brinker International (EAT): A Closer Look at Its Undervalued StatusUnveiling the True Worth of Brinker International (EAT) |
Anheuser-Busch, Bumble, Brinker: Top Stock UpgradesThe stock market digests this morning's cooling PCE data on the final trading day of 2023's third quarter. Bank of America analysts upgrade Anheuser-Busch's (BUD) stock after beer drinkers boycotted the Bud Light distributor earlier in the year. Loop Capital Markets analysts upgrade dating app Bumble (BMBL) after finding the stock to be "de-risked." Lastly, Stifel analysts upgrade Brinker International (EAT) on the outlook of its chain restaurants like Chili's. Yahoo Finance Live anchors Seana Smith and Brad Smith highlight analyst upgrades from trending stocks this morning from the Nasdaq MarketSite. For more expert insight and the latest market action, click here to watch this full episode of Yahoo Finance Live. |
Why Restaurant Stocks Could Be Worth a BiteA recession is baked into restaurant stock prices, offering investors a buying opportunity. The median full-service restaurant stock is trading at about 13.8 times 2024 earnings, while the S&P 500 is changing hands at about 18 times. The discount has been larger just three times in the past 15 years, the analysts wrote: During the global financial crisis, after Covid-19 related shutdowns in 2020, and shortly after Russia invaded Ukraine last year. |
Unveiling Brinker International (EAT)'s Value: Is It Really Priced Right? A Comprehensive GuideAn in-depth analysis of Brinker International's current market value, financial strength, profitability, and growth prospects |
EAT Price Returns
1-mo | N/A |
3-mo | -14.72% |
6-mo | N/A |
1-year | 13.68% |
3-year | -30.17% |
5-year | -30.70% |
YTD | -4.67% |
2022 | -12.79% |
2021 | -35.32% |
2020 | 36.16% |
2019 | -0.92% |
2018 | 17.27% |
Continue Researching EAT
Want to see what other sources are saying about Brinker International Inc's financials and stock price? Try the links below:Brinker International Inc (EAT) Stock Price | Nasdaq
Brinker International Inc (EAT) Stock Quote, History and News - Yahoo Finance
Brinker International Inc (EAT) Stock Price and Basic Information | MarketWatch
Loading social stream, please wait...