Emergent Biosolutions, Inc. (EBS): Price and Financial Metrics


Emergent Biosolutions, Inc. (EBS): $8.17

0.10 (+1.24%)

POWR Rating

Component Grades

Growth

S

Value

I

Momentum

G

Stability

N

Sentiment

U

Quality

P

Add EBS to Watchlist
Sign Up

Industry: Biotech


Ranked

of

in industry

EBS POWR Grades

  • Value is the dimension where EBS ranks best; there it ranks ahead of 85.39% of US stocks.
  • The strongest trend for EBS is in Growth, which has been heading down over the past 178 days.
  • EBS ranks lowest in Sentiment; there it ranks in the 1st percentile.

EBS Stock Summary

  • As for revenue growth, note that EBS's revenue has grown -37.47% over the past 12 months; that beats the revenue growth of just 5.63% of US companies in our set.
  • The volatility of EMERGENT BIOSOLUTIONS INC's share price is greater than that of 91.49% US stocks with at least 200 days of trading history.
  • EMERGENT BIOSOLUTIONS INC's shareholder yield -- a measure of how much capital is returned to stockholders via dividends and buybacks -- is -119.64%, greater than the shareholder yield of only 5.26% of stocks in our set.
  • Stocks that are quantitatively similar to EBS, based on their financial statements, market capitalization, and price volatility, are NOVT, CSGS, PRGS, MDRX, and CRNT.
  • Visit EBS's SEC page to see the company's official filings. To visit the company's web site, go to www.emergentbiosolutions.com.

EBS Valuation Summary

  • EBS's price/sales ratio is 0.4; this is 91.49% lower than that of the median Healthcare stock.
  • EBS's price/earnings ratio has moved down 53.6 over the prior 199 months.

Below are key valuation metrics over time for EBS.

Stock Date P/S P/B P/E EV/EBIT
EBS 2023-03-17 0.4 0.3 -1.8 -6.3
EBS 2023-03-16 0.4 0.3 -2.2 -6.8
EBS 2023-03-15 0.4 0.3 -2.2 -6.8
EBS 2023-03-14 0.4 0.4 -2.2 -6.8
EBS 2023-03-13 0.4 0.3 -2.1 -6.7
EBS 2023-03-10 0.4 0.4 -2.2 -6.8

EBS Growth Metrics

    Its 3 year cash and equivalents growth rate is now at 217.32%.
  • The 2 year cash and equivalents growth rate now stands at 139.96%.
  • Its 4 year revenue growth rate is now at 115.98%.
EBS's revenue has moved up $807,924,000 over the prior 49 months.

The table below shows EBS's growth in key financial areas (numbers in millions of US dollars).

Date Revenue Operating Cash Flow Net Income to Common Stock
2022-09-30 1,513.4 202.1 53.5
2022-06-30 1,602.4 292.8 96.5
2022-03-31 1,757.2 278.7 157.5
2021-12-31 1,792.7 321.1 230.9
2021-09-30 1,652.5 237.2 227
2021-06-30 1,708.7 325.7 299.2

EBS's Quality Factors

The “Quality” component of the POWR Ratings focuses on 31 different factors of a companies fundamentals and operational strength. Here are some key insights as we drill into the specifics of these quality attributes.
  • EBS has a Quality Grade of C, ranking ahead of 50.38% of graded US stocks.
  • EBS's asset turnover comes in at 0.604 -- ranking 57th of 681 Pharmaceutical Products stocks.
  • ARWR, IBIO, and MCRB are the stocks whose asset turnover ratios are most correlated with EBS.

The table below shows EBS's key quality metrics over time.

Period Asset Turnover Gross Margin ROIC
2021-06-30 0.604 0.623 0.227
2021-03-31 0.628 0.680 0.298
2020-12-31 0.607 0.663 0.247
2020-09-30 0.550 0.633 0.146
2020-06-30 0.536 0.645 0.152
2020-03-31 0.478 0.622 0.076

EBS Price Target

For more insight on analysts targets of EBS, see our EBS price target page. And for a list of of all stocks sorted by upside potential based on analyst target price, see our Top Price Target page.

Average Price Target $85.71 Average Broker Recommendation 1.69 (Moderate Buy)

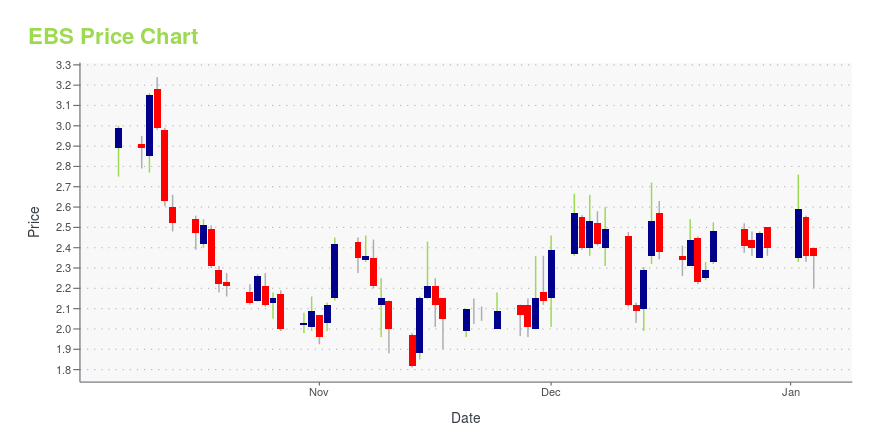
EBS Stock Price Chart Interactive Chart >

Price chart for EBS

EBS Price/Volume Stats

Current price $8.17 52-week high $45.14
Prev. close $8.07 52-week low $8.01
Day low $8.01 Volume 1,084,200
Day high $8.31 Avg. volume 1,154,626
50-day MA $12.55 Dividend yield N/A
200-day MA $20.07 Market Cap 409.64M

Emergent Biosolutions, Inc. (EBS) Company Bio


Emergent BioSolutions is a biopharmaceutical company which develops, manufactures, and delivers a portfolio of medical countermeasures for biological and chemical threats as well as emerging infectious diseases. The company was founded in 1998 and is based in Gaithersburg, Maryland.


EBS Latest News Stream


Event/Time News Detail
Loading, please wait...

EBS Latest Social Stream


Loading social stream, please wait...

View Full EBS Social Stream

Latest EBS News From Around the Web

Below are the latest news stories about EMERGENT BIOSOLUTIONS INC that investors may wish to consider to help them evaluate EBS as an investment opportunity.

Emergent BioSolutions Inc. (NYSE:EBS) Q4 2022 Earnings Call Transcript

Emergent BioSolutions Inc. (NYSE:EBS) Q4 2022 Earnings Call Transcript February 27, 2023 Operator: Good day and thank you for standing by. Welcome to the Emergent BioSolutions Fourth Quarter and Full Year 2022 Financial Results Conference Call. At this time, all participants are in a listen-only mode. After the speakers’ presentation, there will be a question-and-answer […]

Yahoo | March 10, 2023

Today’s Biggest Pre-Market Stock Movers: 10 Top Gainers and Losers on Thursday

It's time for another breakdown of the biggest pre-market stock movers traders will want to know about on Thursday morning!

William White on InvestorPlace | March 9, 2023

Emergent BioSolutions Full Year 2022 Earnings: Revenues Beat Expectations, EPS Lags

Emergent BioSolutions ( NYSE:EBS ) Full Year 2022 Results Key Financial Results Revenue: US$1.12b (down 38% from FY...

Yahoo | March 1, 2023

Why Emergent BioSolutions Stock Tumbled by Almost 12% Today

Emergent BioSolutions (NYSE: EBS) probably wishes it had stayed in bed on Tuesday. For its fourth quarter of 2022, Emergent booked revenue of just under $331 million, which was 54% below the same quarter of the previous year. Of its two business divisions, Emergent's services unit was a real problem area.

Yahoo | February 28, 2023

Emergent's (EBS) Q4 Earnings Miss, Sales Beat Estimates

Emergent (EBS) reported mixed fourth-quarter 2022 results. While the company significantly misses the mark on earnings, it beat sales estimates.

Yahoo | February 28, 2023

Read More 'EBS' Stories Here

EBS Price Returns

1-mo N/A
3-mo -26.00%
6-mo -60.83%
1-year -80.79%
3-year -83.44%
5-year -84.57%
YTD -30.82%
2022 -72.83%
2021 -51.48%
2020 66.08%
2019 -8.99%
2018 27.57%

Get Free Updates

Join thousands of investors who get the latest news, insights and top rated picks from StockNews.com!


Page generated in 0.8765 seconds.