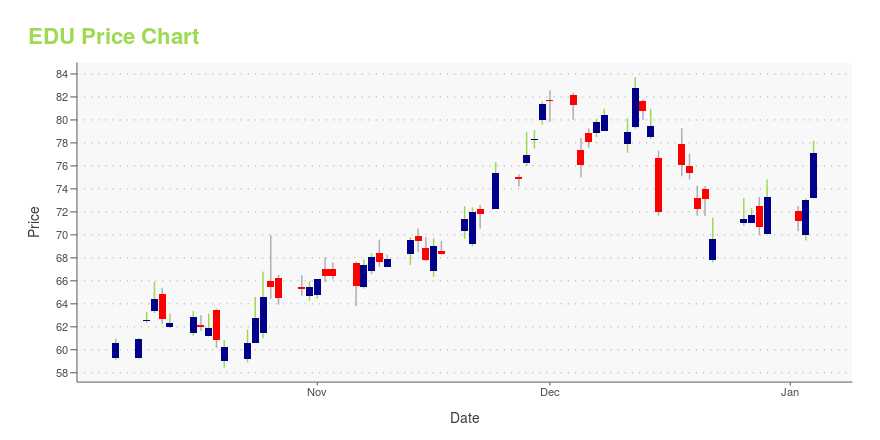
New Oriental Education & Technology Group Inc. ADR (EDU): Price and Financial Metrics
EDU Price/Volume Stats
| Current price | $46.96 | 52-week high | $91.04 |
| Prev. close | $47.59 | 52-week low | $44.46 |
| Day low | $46.32 | Volume | 860,100 |
| Day high | $47.77 | Avg. volume | 1,914,000 |
| 50-day MA | $49.65 | Dividend yield | N/A |
| 200-day MA | $62.50 | Market Cap | 7.97B |
EDU Stock Price Chart Interactive Chart >
New Oriental Education & Technology Group Inc. ADR (EDU) Company Bio
New Oriental Education & Technology Group Inc. (Chinese: 新东方教育科技集团, NYSE: EDU, SEHK: 9901), more commonly New Oriental (Chinese: 新东方), is a provider of private educational services in China. The headquarters of New Oriental is located in Haidian District, Beijing. It is currently the largest comprehensive private educational company in China based on the number of program offerings, total student enrollments, and geographic presence. The business of New Oriental includes pre-school education, general courses for students of various age levels, online education, overseas study consulting, and textbook publishing. New Oriental was the first Chinese educational institution to enter the New York Stock Exchange in the United States, holding its IPO in 2006. As of 2016, New Oriental has built 67 short-time language educational schools, 20 book stores, 771 learning centers, and more than 5,000 third-party bookstores in 56 cities in China. New Oriental has had over 26.6 million student enrollments, including over 1.3 million enrollments in first quarter 2017. The company's market capitalization was approximately US$14 billion. (Source:Wikipedia)
EDU Price Returns
| 1-mo | -0.70% |
| 3-mo | -25.70% |
| 6-mo | -36.08% |
| 1-year | -45.91% |
| 3-year | 284.92% |
| 5-year | -58.33% |
| YTD | -26.83% |
| 2024 | -12.42% |
| 2023 | 110.45% |
| 2022 | 65.81% |
| 2021 | -88.70% |
| 2020 | 53.25% |
Continue Researching EDU
Want to do more research on New Oriental Education & Technology Group Inc's stock and its price? Try the links below:New Oriental Education & Technology Group Inc (EDU) Stock Price | Nasdaq
New Oriental Education & Technology Group Inc (EDU) Stock Quote, History and News - Yahoo Finance
New Oriental Education & Technology Group Inc (EDU) Stock Price and Basic Information | MarketWatch


Loading social stream, please wait...