Euronet Worldwide, Inc. (EEFT): Price and Financial Metrics
GET POWR RATINGS... FREE!
EEFT POWR Grades
- EEFT scores best on the Growth dimension, with a Growth rank ahead of 93.8% of US stocks.
- EEFT's strongest trending metric is Momentum; it's been moving down over the last 179 days.
- EEFT's current lowest rank is in the Sentiment metric (where it is better than 38.47% of US stocks).
EEFT Stock Summary
- Euronet Worldwide Inc's capital turnover -- a measure of revenue relative to shareholder's equity -- is better than 79.07% of US listed stocks.
- With a price/earnings ratio of 92.78, Euronet Worldwide Inc P/E ratio is greater than that of about 92.67% of stocks in our set with positive earnings.
- Over the past twelve months, EEFT has reported earnings growth of 289.46%, putting it ahead of 92.63% of US stocks in our set.
- If you're looking for stocks that are quantitatively similar to Euronet Worldwide Inc, a group of peers worth examining would be SYNL, SGFY, STRA, BOH, and GBL.
- Visit EEFT's SEC page to see the company's official filings. To visit the company's web site, go to www.euronetworldwide.com.
EEFT Valuation Summary
- In comparison to the median Technology stock, EEFT's EV/EBIT ratio is 29.61% higher, now standing at 41.8.
- Over the past 243 months, EEFT's price/sales ratio has gone down 1.8.
- EEFT's price/earnings ratio has moved up 77 over the prior 243 months.
Below are key valuation metrics over time for EEFT.
Stock | Date | P/S | P/B | P/E | EV/EBIT |
---|---|---|---|---|---|
EEFT | 2021-09-01 | 2.6 | 5.0 | 64.8 | 41.8 |
EEFT | 2021-08-31 | 2.6 | 4.9 | 63.7 | 41.1 |
EEFT | 2021-08-30 | 2.6 | 4.9 | 63.9 | 41.2 |
EEFT | 2021-08-27 | 2.6 | 5.0 | 65.1 | 42.0 |
EEFT | 2021-08-26 | 2.6 | 4.9 | 63.9 | 41.2 |
EEFT | 2021-08-25 | 2.6 | 5.0 | 65.3 | 42.2 |
EEFT Growth Metrics
- Its 3 year net income to common stockholders growth rate is now at 99.61%.
- The 3 year cash and equivalents growth rate now stands at 120.26%.
- Its 4 year price growth rate is now at 16.73%.

The table below shows EEFT's growth in key financial areas (numbers in millions of US dollars).
Date | Revenue | Operating Cash Flow | Net Income to Common Stock |
---|---|---|---|
2021-12-31 | 2,995.443 | 406.576 | 70.727 |
2021-09-30 | 2,890.555 | 337.429 | 144.087 |
2021-06-30 | 2,738.346 | 248.255 | 110.454 |
2021-03-31 | 2,551.463 | 144.976 | -13.985 |
2020-12-31 | 2,482.7 | 253.505 | -3.399 |
2020-09-30 | 2,469.808 | 360.525 | 32.812 |
EEFT's Quality Factors
The “Quality” component of the POWR Ratings focuses on 31 different factors of a companies fundamentals and operational strength. Here are some key insights as we drill into the specifics of these quality attributes.- EEFT has a Quality Grade of C, ranking ahead of 39.67% of graded US stocks.
- EEFT's asset turnover comes in at 0.634 -- ranking 8th of 428 Banking stocks.
- SNV, BKU, and BHLB are the stocks whose asset turnover ratios are most correlated with EEFT.
The table below shows EEFT's key quality metrics over time.
Period | Asset Turnover | Gross Margin | ROIC |
---|---|---|---|
2021-09-30 | 0.634 | 0.360 | 0.111 |
2021-06-30 | 0.615 | 0.353 | 0.089 |
2021-03-31 | 0.589 | 0.353 | 0.021 |
2020-12-31 | 0.578 | 0.365 | 0.024 |
2020-09-30 | 0.585 | 0.384 | 0.052 |
2020-06-30 | 0.606 | 0.414 | 0.114 |
EEFT Price Target
For more insight on analysts targets of EEFT, see our EEFT price target page. And for a list of of all stocks sorted by upside potential based on analyst target price, see our Top Price Target page.
Average Price Target | $181.71 | Average Broker Recommendation | 1.36 (Strong Buy) |
EEFT Stock Price Chart Interactive Chart >
EEFT Price/Volume Stats
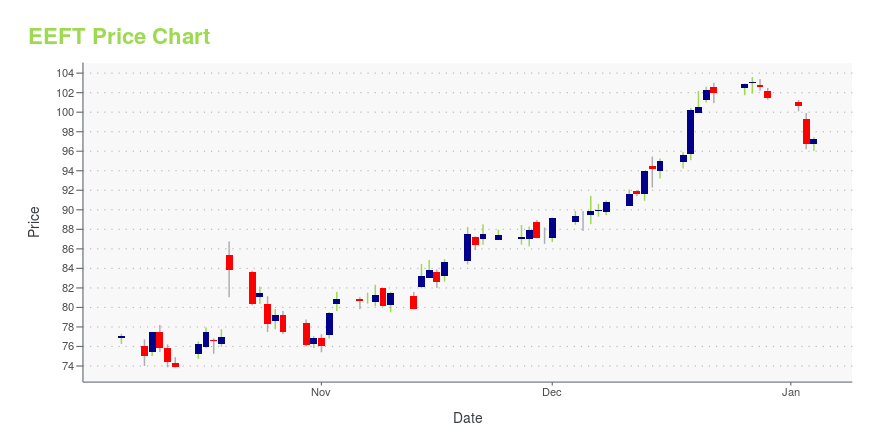
Current price | $100.59 | 52-week high | $149.92 |
Prev. close | $102.97 | 52-week low | $96.30 |
Day low | $98.84 | Volume | 288,221 |
Day high | $102.08 | Avg. volume | 558,586 |
50-day MA | $115.51 | Dividend yield | N/A |
200-day MA | $121.73 | Market Cap | 5.08B |
Euronet Worldwide, Inc. (EEFT) Company Bio
Euronet Worldwide offers payment and transaction processing solutions to financial institutions, retailers, service providers and individual consumers. The company was founded in 1994 and is based in Leawood, Kansas.
Latest EEFT News From Around the Web
Below are the latest news stories about Euronet Worldwide Inc that investors may wish to consider to help them evaluate EEFT as an investment opportunity.
New Strong Sell Stocks for February 17thCOHU, CS, and EEFT have been added to the Zacks Rank #5 (Strong Sell) List on February 17, 2022 |
Euronet Non-GAAP EPS of $1.15 misses by $0.16, revenue of $811.5M beats by $2.15MEuronet press release (NASDAQ:EEFT): Q4 Non-GAAP EPS of $1.15 misses by $0.16. Revenue of $811.5M (+14.8% Y/Y) beats by $2.15M. Adjusted EBITDA of $112.9M, a 23% increase from $91.9M (27% increase on a constant currency basis). Adjusted operating income of $67.6M, a 33% increase from $50.8M (38% increase on a constant currency basis).... |
Euronet Worldwide (EEFT) Receives a Buy from NeedhamNeedham analyst Mayank Tandon reiterated a Buy rating on Euronet Worldwide (EEFT – Research Report) today and set a price target of $190.00. The company's shares closed last Thursday at $146.92. According to TipRanks.com, Tandon is a 5-star analyst with an average return of 20.2% and a 58.4% success rate. Tandon covers the Technology sector, focusing on stocks such as SS&C Technologies Holdings, Bottomline Technologies, and Duck Creek Technologies. Currently, the analyst consensus on Euronet Worldwide is a Strong Buy with an average price target of $177.50. |
Euronet Worldwide Clocks 15% Revenue Growth In Q4 Backed By EFT RecoveryEuronet Worldwide Inc (NASDAQ: EEFT ) reported fourth-quarter FY21 sales growth of 15% year-on-year to $811.5 million, beating the consensus of $809.4 million. Revenues from the EFT processing segment climbed 63% Y/Y, the epay segment rose 4%, and the Money Transfer Segment segment recorded an Full story available on Benzinga.com |
Euronet Worldwide, Inc. 2021 Q4 - Results - Earnings Call PresentationNo summary available. |
EEFT Price Returns
1-mo | -16.98% |
3-mo | -23.81% |
6-mo | -15.59% |
1-year | -25.68% |
3-year | -39.94% |
5-year | 15.13% |
YTD | -15.59% |
2021 | -17.77% |
2020 | -8.02% |
2019 | 53.90% |
2018 | 21.49% |
2017 | 16.35% |
Continue Researching EEFT
Want to see what other sources are saying about Euronet Worldwide Inc's financials and stock price? Try the links below:Euronet Worldwide Inc (EEFT) Stock Price | Nasdaq
Euronet Worldwide Inc (EEFT) Stock Quote, History and News - Yahoo Finance
Euronet Worldwide Inc (EEFT) Stock Price and Basic Information | MarketWatch
Loading social stream, please wait...