Energy Focus, Inc. (EFOI): Price and Financial Metrics
GET POWR RATINGS... FREE!
EFOI POWR Grades
- EFOI scores best on the Value dimension, with a Value rank ahead of 60.61% of US stocks.
- EFOI's strongest trending metric is Growth; it's been moving down over the last 63 days.
- EFOI's current lowest rank is in the Stability metric (where it is better than 1.9% of US stocks).
EFOI Stock Summary
- With a market capitalization of $7,623,313, ENERGY FOCUS INC has a greater market value than only 2.07% of US stocks.
- The volatility of ENERGY FOCUS INC's share price is greater than that of 96.23% US stocks with at least 200 days of trading history.
- ENERGY FOCUS INC's shareholder yield -- a measure of how much capital is returned to stockholders via dividends and buybacks -- is -95.73%, greater than the shareholder yield of just 5.7% of stocks in our set.
- Stocks that are quantitatively similar to EFOI, based on their financial statements, market capitalization, and price volatility, are RMTI, BELFA, BC, VNT, and ITRN.
- EFOI's SEC filings can be seen here. And to visit ENERGY FOCUS INC's official web site, go to www.energyfocus.com.
EFOI Valuation Summary
- EFOI's price/sales ratio is 1; this is 47.37% lower than that of the median Consumer Cyclical stock.
- EFOI's price/earnings ratio has moved up 4.6 over the prior 243 months.
Below are key valuation metrics over time for EFOI.
Stock | Date | P/S | P/B | P/E | EV/EBIT |
---|---|---|---|---|---|
EFOI | 2023-01-26 | 1.0 | 5.0 | -0.7 | -1.4 |
EFOI | 2023-01-25 | 0.9 | 4.7 | -0.7 | -1.4 |
EFOI | 2023-01-24 | 0.9 | 4.7 | -0.7 | -1.4 |
EFOI | 2023-01-23 | 0.9 | 4.7 | -0.7 | -1.4 |
EFOI | 2023-01-20 | 0.9 | 4.3 | -0.6 | -1.3 |
EFOI | 2023-01-19 | 0.8 | 4.2 | -0.6 | -1.3 |
EFOI Growth Metrics
- Its 4 year net cashflow from operations growth rate is now at 81.69%.
- Its 2 year cash and equivalents growth rate is now at -92.27%.
- Its 5 year net income to common stockholders growth rate is now at 74%.

The table below shows EFOI's growth in key financial areas (numbers in millions of US dollars).
Date | Revenue | Operating Cash Flow | Net Income to Common Stock |
---|---|---|---|
2022-09-30 | 7.71 | -7.581 | -10.6 |
2022-06-30 | 8.695 | -9.005 | -9.078 |
2022-03-31 | 9.289 | -9.685 | -9.065 |
2021-12-31 | 9.865 | -9.765 | -7.886 |
2021-09-30 | 11.206 | -9.288 | -5.19 |
2021-06-30 | 14.421 | -7.853 | -5.215 |
EFOI's Quality Factors
The “Quality” component of the POWR Ratings focuses on 31 different factors of a companies fundamentals and operational strength. Here are some key insights as we drill into the specifics of these quality attributes.- EFOI has a Quality Grade of D, ranking ahead of 8.84% of graded US stocks.
- EFOI's asset turnover comes in at 1.105 -- ranking 7th of 53 Electrical Equipment stocks.
- CCF, NOVT, and AME are the stocks whose asset turnover ratios are most correlated with EFOI.
The table below shows EFOI's key quality metrics over time.
Period | Asset Turnover | Gross Margin | ROIC |
---|---|---|---|
2021-06-30 | 1.105 | 0.260 | -0.690 |
2021-03-31 | 1.190 | 0.300 | -1.163 |
2020-12-31 | 1.275 | 0.308 | -0.980 |
2020-09-30 | 1.275 | 0.283 | -1.084 |
2020-06-30 | 1.066 | 0.321 | -0.853 |
2020-03-31 | 1.027 | 0.218 | -0.491 |
EFOI Price Target
For more insight on analysts targets of EFOI, see our EFOI price target page. And for a list of of all stocks sorted by upside potential based on analyst target price, see our Top Price Target page.
Average Price Target | $11.00 | Average Broker Recommendation | 1.5 (Moderate Buy) |
EFOI Stock Price Chart Interactive Chart >
EFOI Price/Volume Stats
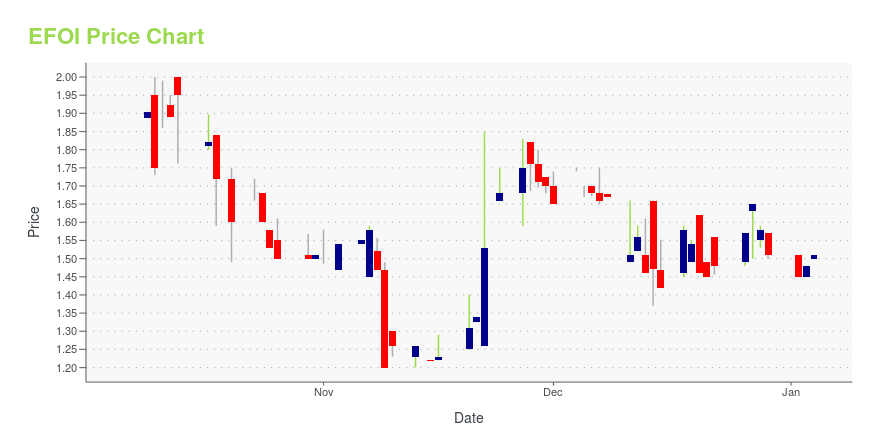
Current price | $0.80 | 52-week high | $3.12 |
Prev. close | $0.81 | 52-week low | $0.28 |
Day low | $0.77 | Volume | 117,500 |
Day high | $0.84 | Avg. volume | 206,840 |
50-day MA | $0.46 | Dividend yield | N/A |
200-day MA | $0.78 | Market Cap | 7.62M |
Energy Focus, Inc. (EFOI) Company Bio
Energy Focus, Inc. designs, develops, manufactures, markets, and installs energy-efficient lighting systems and solutions in the United States and internationally. The company was formerly known as Fiberstars, Inc. and changed its name to Energy Focus, Inc. in May 2007. The company was founded in 1985 and is based in Solon, Ohio.
Latest EFOI News From Around the Web
Below are the latest news stories about ENERGY FOCUS INC that investors may wish to consider to help them evaluate EFOI as an investment opportunity.
Energy Focus Announces Strategic Partnership and Investment from Sander ElectronicsNewly forged partnership allows EFOI to expand product portfolio to include a wide range of energy solution products. |
Today’s Biggest Pre-Market Stock Movers: 10 Top Gainers and Losers on WednesdayWe're starting off the day with a breakdown of the biggest pre-market stock movers traders need to know about on Wednesday |
Why Core Scientific Shares Are Trading Lower By Around 32%; Here Are 26 Stocks Moving PremarketGainers ADC Therapeutics SA (NASDAQ: ADCT ) shares rose 36.8% to $4.35 in pre-market trading. ADC Therapeutics and Sobi announced European Commission approval of ZYNLONTA for the treatment of relapsed or refractory diffuse large B-cell lymphoma. Energy Focus, Inc. (NASDAQ: EFOI ) rose 22.1% to $0.3899 in pre-market trading after declining 11% on Tuesday. Energy Focus, last month, posted a Q3 loss of $0.29 per share. Caravelle International Group (NASDAQ: CACO ) shares rose 21.8% to $2.57 in pre-market trading after dropping 57% on Tuesday. 180 Life Sciences Corp. (NASDAQ: ATNF ) rose 18.8% to $2.65 in pre-market trading. 180 Life Sciences Corp shares dropped 15% on Tuesday after the company announced a $6 million registered direct offering. Grove Collaborative Holdings, Inc. (NYSE: GROV... |
Investing in Energy Focus Inc. (EFOI) might be an excellent idea, but the stock is currently overvalued/undervaluedA share of Energy Focus Inc. (NASDAQ:EFOI) closed at $0.42 per share on Tuesday, up from $0.38 day before. While Energy Focus Inc. has overperformed by 9.16%, investors are advised to look at stock chart patterns for technical insight. Within its last year performance, EFOI fell by -91.06%, with highs and lows ranging from $6.12 […] |
Energy Focus Third Quarter 2022 Earnings: Misses ExpectationsEnergy Focus ( NASDAQ:EFOI ) Third Quarter 2022 Results Key Financial Results Revenue: US$1.76m (down 36% from 3Q... |
EFOI Price Returns
1-mo | N/A |
3-mo | 102.58% |
6-mo | -1.48% |
1-year | -53.22% |
3-year | -73.33% |
5-year | -93.98% |
YTD | 153.97% |
2022 | -92.62% |
2021 | 5.96% |
2020 | 70.33% |
2019 | -23.55% |
2018 | -74.73% |
Continue Researching EFOI
Want to see what other sources are saying about Energy Focus Inc's financials and stock price? Try the links below:Energy Focus Inc (EFOI) Stock Price | Nasdaq
Energy Focus Inc (EFOI) Stock Quote, History and News - Yahoo Finance
Energy Focus Inc (EFOI) Stock Price and Basic Information | MarketWatch
Loading social stream, please wait...