Enterprise Financial Services Corporation (EFSC): Price and Financial Metrics

Enterprise Financial Services Corporation (EFSC): $41.62

0.41 (+0.99%)

POWR Rating

Component Grades

Growth

S

Value

I

Momentum

G

Stability

N

Sentiment

U

Quality

P

EFSC Price/Volume Stats

Current price $41.62 52-week high $56.35
Prev. close $41.21 52-week low $36.16
Day low $40.82 Volume 73,500
Day high $41.65 Avg. volume 166,187
50-day MA $42.34 Dividend yield 2.43%
200-day MA $48.00 Market Cap 1.55B

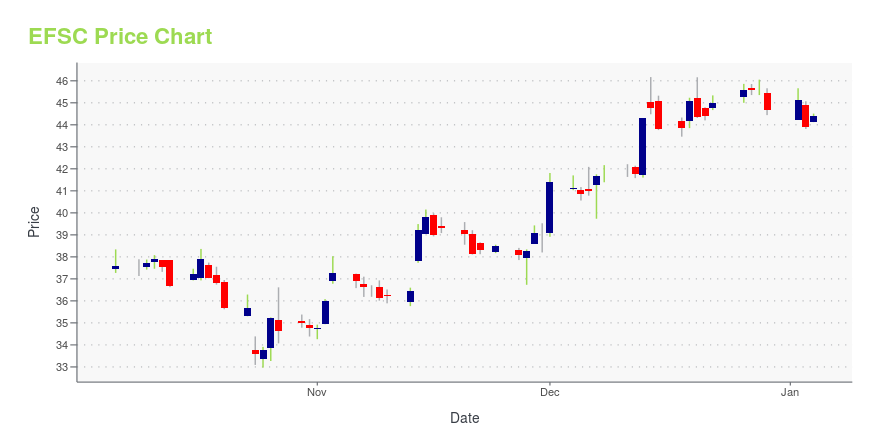
EFSC Stock Price Chart Interactive Chart >

EFSC POWR Grades

  • Sentiment is the dimension where EFSC ranks best; there it ranks ahead of 64.58% of US stocks.
  • EFSC's strongest trending metric is Quality; it's been moving down over the last 179 days.
  • EFSC's current lowest rank is in the Quality metric (where it is better than 22.2% of US stocks).

EFSC Stock Summary

  • With a price/earnings ratio of 7.43, ENTERPRISE FINANCIAL SERVICES CORP P/E ratio is greater than that of about just 22.66% of stocks in our set with positive earnings.
  • Equity multiplier, or assets relative to shareholders' equity, comes in at 8.73 for ENTERPRISE FINANCIAL SERVICES CORP; that's greater than it is for 87.37% of US stocks.
  • In terms of twelve month growth in earnings before interest and taxes, ENTERPRISE FINANCIAL SERVICES CORP is reporting a growth rate of 40.28%; that's higher than 76.39% of US stocks.
  • If you're looking for stocks that are quantitatively similar to ENTERPRISE FINANCIAL SERVICES CORP, a group of peers worth examining would be SFNC, MPB, CHCO, CSTR, and HOMB.
  • Visit EFSC's SEC page to see the company's official filings. To visit the company's web site, go to www.enterprisebank.com.

EFSC Valuation Summary

  • EFSC's price/earnings ratio is 7.1; this is 16.47% lower than that of the median Financial Services stock.
  • EFSC's price/earnings ratio has moved down 17.2 over the prior 242 months.

Below are key valuation metrics over time for EFSC.

Stock Date P/S P/B P/E EV/EBIT
EFSC 2023-05-19 2.6 0.9 7.1 6.1
EFSC 2023-05-18 2.7 0.9 7.2 6.2
EFSC 2023-05-17 2.6 0.9 7.2 6.2
EFSC 2023-05-16 2.5 0.9 6.8 5.9
EFSC 2023-05-15 2.6 0.9 6.9 6.0
EFSC 2023-05-12 2.5 0.9 6.9 5.9

EFSC Growth Metrics

    Its year over year cash and equivalents growth rate is now at 122.96%.
  • The 2 year price growth rate now stands at 56.3%.
  • Its 3 year price growth rate is now at 3.81%.
Over the past 34 months, EFSC's revenue has gone up $257,740,000.

The table below shows EFSC's growth in key financial areas (numbers in millions of US dollars).

Date Revenue Operating Cash Flow Net Income to Common Stock
2022-12-31 533.676 216.64 199.002
2022-09-30 508.441 242.802 190.749
2022-06-30 470.597 210.329 155.399
2022-03-31 448.059 214.133 149.593
2021-12-31 414.552 160.575 133.055
2021-09-30 372.691 140.897 111.175

EFSC's Quality Factors

The “Quality” component of the POWR Ratings focuses on 31 different factors of a companies fundamentals and operational strength. Here are some key insights as we drill into the specifics of these quality attributes.
  • EFSC has a Quality Grade of C, ranking ahead of 28.09% of graded US stocks.
  • EFSC's asset turnover comes in at 0.035 -- ranking 283rd of 430 Banking stocks.
  • PKBK, CFBK, and FBNC are the stocks whose asset turnover ratios are most correlated with EFSC.

The table below shows EFSC's key quality metrics over time.

Period Asset Turnover Gross Margin ROIC
2021-06-30 0.035 1 0.016
2021-03-31 0.032 1 0.013
2020-12-31 0.031 1 0.011
2020-09-30 0.031 1 0.012
2020-06-30 0.034 1 0.014
2020-03-31 0.038 1 0.015

EFSC Price Target

For more insight on analysts targets of EFSC, see our EFSC price target page. And for a list of of all stocks sorted by upside potential based on analyst target price, see our Top Price Target page.

Average Price Target $53.00 Average Broker Recommendation 1.5 (Moderate Buy)

Enterprise Financial Services Corporation (EFSC) Company Bio


Enterprise Financial Services Corp offers banking and wealth management services to individuals and corporate customers in the St. Louis metropolitan area, Kansas City metropolitan area; and Phoenix metropolitan areas. The company was founded in 1988 and is based in Clayton, Missouri.


EFSC Latest News Stream


Event/Time News Detail
Loading, please wait...

EFSC Latest Social Stream


Loading social stream, please wait...

View Full EFSC Social Stream

Latest EFSC News From Around the Web

Below are the latest news stories about ENTERPRISE FINANCIAL SERVICES CORP that investors may wish to consider to help them evaluate EFSC as an investment opportunity.

Enterprise Financial Services (NASDAQ:EFSC) Is Increasing Its Dividend To $0.25

Enterprise Financial Services Corp ( NASDAQ:EFSC ) has announced that it will be increasing its dividend from last...

Yahoo | May 15, 2023

Enterprise Financial Services Corp (NASDAQ:EFSC) Q1 2023 Earnings Call Transcript

Enterprise Financial Services Corp (NASDAQ:EFSC) Q1 2023 Earnings Call Transcript April 25, 2023 Enterprise Financial Services Corp beats earnings expectations. Reported EPS is $1.46, expectations were $1.37. Operator: Good morning. My name is David, and I’ll be your conference operator today. At this time, I’d like to welcome everyone to the Enterprise Financial Services Corp. […]

Yahoo | May 2, 2023

Enterprise Financial Services' (NASDAQ:EFSC) Shareholders Will Receive A Bigger Dividend Than Last Year

Enterprise Financial Services Corp ( NASDAQ:EFSC ) has announced that it will be increasing its dividend from last...

Yahoo | April 28, 2023

Q1 2023 Enterprise Financial Services Corp Earnings Call

Q1 2023 Enterprise Financial Services Corp Earnings Call

Yahoo | April 26, 2023

Enterprise Financial Services (EFSC) Q1 Earnings and Revenues Beat Estimates

Enterprise Financial Services (EFSC) delivered earnings and revenue surprises of 6.57% and 1.49%, respectively, for the quarter ended March 2023. Do the numbers hold clues to what lies ahead for the stock?

Yahoo | April 24, 2023

Read More 'EFSC' Stories Here

EFSC Price Returns

1-mo -2.67%
3-mo -22.89%
6-mo -18.56%
1-year -8.29%
3-year 48.44%
5-year -15.32%
YTD -14.53%
2022 6.02%
2021 36.90%
2020 -25.74%
2019 29.99%
2018 -15.86%

EFSC Dividends

Ex-Dividend Date Type Payout Amount Change
Loading, please wait...
View Full EFSC Dividend History

Get Free Updates

Join thousands of investors who get the latest news, insights and top rated picks from StockNews.com!


Page generated in 0.9286 seconds.