
eGain Corporation (EGAN): Price and Financial Metrics
EGAN Price/Volume Stats
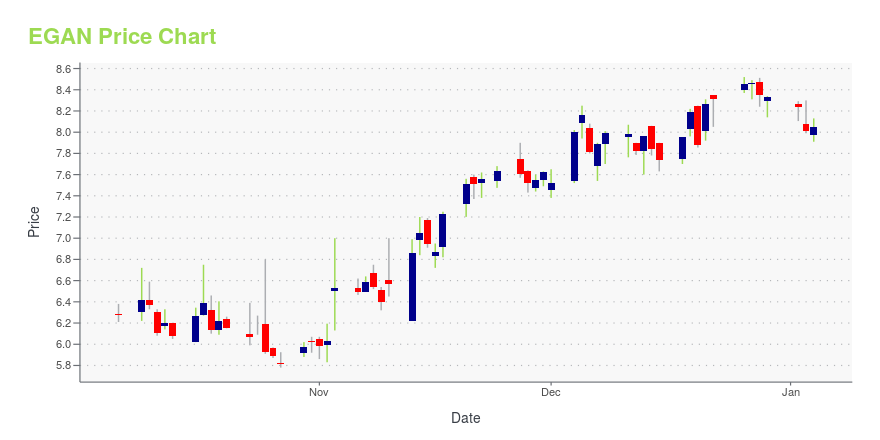
| Current price | $7.51 | 52-week high | $8.52 |
| Prev. close | $7.30 | 52-week low | $5.50 |
| Day low | $7.39 | Volume | 55,750 |
| Day high | $7.54 | Avg. volume | 94,382 |
| 50-day MA | $6.34 | Dividend yield | N/A |
| 200-day MA | $6.70 | Market Cap | 224.00M |
EGAN Stock Price Chart Interactive Chart >
eGain Corporation (EGAN) Company Bio
eGain Corporation provides cloud-based customer engagement software solutions worldwide. The company offers eGain software suite, including eGain Mobile for businesses to offer engagement options in the eGain suite to mobile users. The company was founded in 1997 and is based in Sunnyvale, California.
Latest EGAN News From Around the Web
Below are the latest news stories about EGAIN CORP that investors may wish to consider to help them evaluate EGAN as an investment opportunity.
Why eGain (EGAN) Outpaced the Stock Market TodayThe latest trading day saw eGain (EGAN) settling at $8.31, representing a +0.48% change from its previous close. |
TENAQUIP Selects eGain for Digital Customer ServiceSUNNYVALE, Calif., Dec. 12, 2023 (GLOBE NEWSWIRE) -- eGain Corporation (NASDAQ: EGAN), the knowledge automation platform for customer engagement, announced that TENAQUIP Limited, a leading distributor of industrial supplies, selected eGain for digital customer service (DCS). One of Canada’s Best Managed Companies, TENAQUIP is committed to providing exceptional customer service, appropriately named “Signature Service,” to match the high quality of products they distribute. The company sells and d |
Investment Management Giant Selects eGain to Modernize Knowledge ManagementSUNNYVALE, Calif., Dec. 05, 2023 (GLOBE NEWSWIRE) -- eGain Corporation (NASDAQ: EGAN), the knowledge automation platform for customer engagement, announced that a global investment management company has selected eGain Knowledge Hub™ to transform experiences for thousands of contact center agents, financial advisors, and knowledge authors. Investment management CX has been stuck on a plateau six years in a row, according to the Forrester CX Index. Saddled with a legacy system, the company’s inve |
David Kanen, president of Kwm llc issues letter to the eGain board calling for the formation of a special committee and sale of egan. He also excoriates CEO Ashu Roy.CORAL SPRINGS, Fla., Dec. 04, 2023 (GLOBE NEWSWIRE) -- Dear EGAN Board of Directors, We, Kanen Wealth Management, LLC, owner of approximately 7% of eGain Corporation’s (“EGAN” or the “Company”) common shares, are calling on the board to formally hire an investment banker and form a special committee to pursue a sale of the Company. Under CEO Ashu Roy’s leadership, EGAN’s stock is down approximately 40% since the Company’s IPO 24 years ago in 1999 versus the NASDAQ gain of approximately 500%. The |
Time to Buy These Affordable Tech Stocks for More UpsideSporting a Zacks Rank #1 (Strong Buy) now looks like an ideal time to invest in these affordable and promising tech stocks for more upside. |
EGAN Price Returns
| 1-mo | 24.34% |
| 3-mo | 20.16% |
| 6-mo | -1.05% |
| 1-year | 8.53% |
| 3-year | -34.81% |
| 5-year | -7.28% |
| YTD | -9.84% |
| 2023 | -7.75% |
| 2022 | -9.52% |
| 2021 | -15.50% |
| 2020 | 49.12% |
| 2019 | 20.55% |
Continue Researching EGAN
Want to see what other sources are saying about EGAIN Corp's financials and stock price? Try the links below:EGAIN Corp (EGAN) Stock Price | Nasdaq
EGAIN Corp (EGAN) Stock Quote, History and News - Yahoo Finance
EGAIN Corp (EGAN) Stock Price and Basic Information | MarketWatch
Loading social stream, please wait...