
EHANG HOLDINGS LTD (EH): Price and Financial Metrics
EH Price/Volume Stats
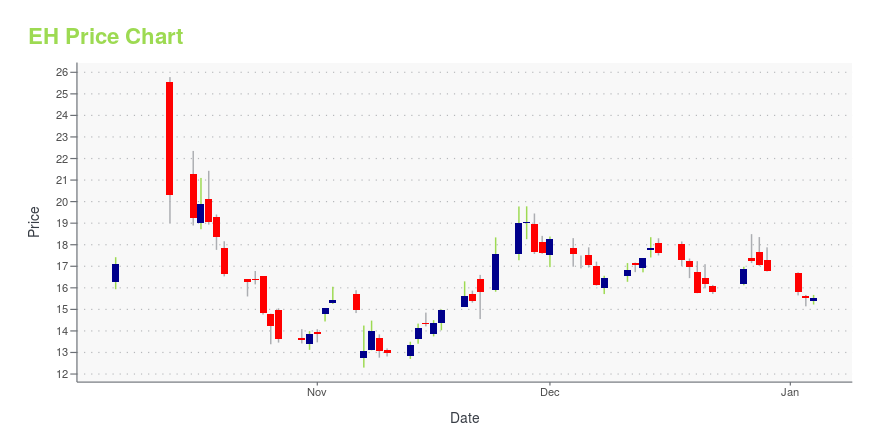
| Current price | $12.79 | 52-week high | $25.78 |
| Prev. close | $12.42 | 52-week low | $9.51 |
| Day low | $12.40 | Volume | 435,630 |
| Day high | $12.79 | Avg. volume | 1,176,052 |
| 50-day MA | $14.98 | Dividend yield | N/A |
| 200-day MA | $15.23 | Market Cap | 812.24M |
EH Stock Price Chart Interactive Chart >
EHANG HOLDINGS LTD (EH) Company Bio
EHang Holdings Ltd. operates as an autonomous aerial vehicle technology platform company. It engages in designing, developing, manufacturing, selling and operating AAVs and their supporting systems and infrastructure for a broad range of industries and applications, including passenger transportation, logistics, smart city management and aerial media solutions. The company was founded by Huazhi Hu and Yifang Derrick Xiong in December 2014 and is headquartered in Guangzhou, China.
Latest EH News From Around the Web
Below are the latest news stories about EHANG HOLDINGS LTD that investors may wish to consider to help them evaluate EH as an investment opportunity.
Buying Guangzhou EHang Stock In A Zig-Zag PullbackGuangzhou EHang Intelligent Technology Co. Ltd. is a Chinese designer and manufacturer of autonomous aerial vehicles (AAVs) and passenger AAVs. Here is a closer look at how shares of EHang have recently traded. |
7 Emerging Markets Stocks With Strong Growth PotentialEmerging market stocks are a great way to diversify a portfolio that may be too focused on U.S.-based stocks. |
To the Skies: 3 Flying Car Stocks to Buy for the Future of TransportationSoar into the future with these flying car stocks that are offering investors a chance at sky high profits. |
EHang’s Certified EH216-S Pilotless Passenger-Carrying Aerial Vehicles Debut Commercial Flight Demonstrations in Guangzhou and HefeiEHang’s Certified EH216-S Pilotless Passenger-Carrying Aerial Vehicles Debut Commercial Flight Demonstrations in Guangzhou and Hefei EH216-S flight demonstration events in Guangzhou and Hefei EHang’s Certified EH216-S Pilotless Passenger-Carrying Aerial Vehicles Debut Commercial Flight Demonstrations in Guangzhou and Hefei EH216-S completed commercial flight demonstration at Guangzhou Jiulong Lake Park. EHang’s Certified EH216-S Pilotless Passenger-Carrying Aerial Vehicles Debut Commercial Fligh |
EH Stock Pops as EHang Unveils UAM CenterEHang and EH stock will now be judged on results after starting deliveries of its eVTOL and opening a launch center near Hong Kong. |
EH Price Returns
| 1-mo | -6.23% |
| 3-mo | -29.88% |
| 6-mo | 5.35% |
| 1-year | -30.90% |
| 3-year | -45.30% |
| 5-year | N/A |
| YTD | -23.87% |
| 2023 | 95.80% |
| 2022 | -42.49% |
| 2021 | -29.32% |
| 2020 | 96.37% |
| 2019 | N/A |
Loading social stream, please wait...