eHealth, Inc. (EHTH): Price and Financial Metrics
GET POWR RATINGS... FREE!
EHTH POWR Grades
- EHTH scores best on the Growth dimension, with a Growth rank ahead of 89.65% of US stocks.
- The strongest trend for EHTH is in Growth, which has been heading up over the past 177 days.
- EHTH ranks lowest in Stability; there it ranks in the 5th percentile.
EHTH Stock Summary
- In terms of twelve month growth in earnings before interest and taxes, EHEALTH INC is reporting a growth rate of 1,294.71%; that's higher than 98.5% of US stocks.
- As for revenue growth, note that EHTH's revenue has grown -23.04% over the past 12 months; that beats the revenue growth of just 8.14% of US companies in our set.
- The volatility of EHEALTH INC's share price is greater than that of 91.88% US stocks with at least 200 days of trading history.
- Stocks with similar financial metrics, market capitalization, and price volatility to EHEALTH INC are TRVG, CPIX, FLNT, GAN, and TKNO.
- EHTH's SEC filings can be seen here. And to visit EHEALTH INC's official web site, go to www.ehealthinsurance.com.
EHTH Valuation Summary
- EHTH's price/earnings ratio is -0.9; this is 107.89% lower than that of the median Financial Services stock.
- Over the past 198 months, EHTH's price/earnings ratio has gone down 193.6.
Below are key valuation metrics over time for EHTH.
Stock | Date | P/S | P/B | P/E | EV/EBIT |
---|---|---|---|---|---|
EHTH | 2023-01-23 | 0.3 | 0.2 | -0.9 | -0.5 |
EHTH | 2023-01-20 | 0.3 | 0.2 | -0.9 | -0.5 |
EHTH | 2023-01-19 | 0.3 | 0.2 | -0.9 | -0.5 |
EHTH | 2023-01-18 | 0.4 | 0.3 | -1.0 | -0.6 |
EHTH | 2023-01-17 | 0.4 | 0.3 | -1.1 | -0.8 |
EHTH | 2023-01-13 | 0.4 | 0.3 | -1.0 | -0.7 |
EHTH Growth Metrics
- Its 2 year cash and equivalents growth rate is now at 19.35%.
- The 2 year revenue growth rate now stands at -6.36%.
- The 3 year net cashflow from operations growth rate now stands at -12898.28%.

The table below shows EHTH's growth in key financial areas (numbers in millions of US dollars).
Date | Revenue | Operating Cash Flow | Net Income to Common Stock |
---|---|---|---|
2022-09-30 | 452.549 | -110.591 | -171.293 |
2022-06-30 | 463.087 | -152.002 | -184.243 |
2022-03-31 | 509.235 | -158.319 | -162.102 |
2021-12-31 | 538.199 | -162.622 | -122.942 |
2021-09-30 | 588.001 | -157.222 | -23.763 |
2021-06-30 | 618.371 | -84.736 | 21.68 |
EHTH's Quality Factors
The “Quality” component of the POWR Ratings focuses on 31 different factors of a companies fundamentals and operational strength. Here are some key insights as we drill into the specifics of these quality attributes.- EHTH has a Quality Grade of C, ranking ahead of 41.37% of graded US stocks.
- EHTH's asset turnover comes in at 0.585 -- ranking 22nd of 133 Insurance stocks.
- TRUP, UFCS, and TIPT are the stocks whose asset turnover ratios are most correlated with EHTH.
The table below shows EHTH's key quality metrics over time.
Period | Asset Turnover | Gross Margin | ROIC |
---|---|---|---|
2021-06-30 | 0.585 | 0.994 | 0.038 |
2021-03-31 | 0.616 | 0.994 | 0.062 |
2020-12-31 | 0.600 | 0.993 | 0.067 |
2020-09-30 | 0.659 | 0.993 | 0.135 |
2020-06-30 | 0.707 | 0.993 | 0.158 |
2020-03-31 | 0.764 | 0.993 | 0.180 |
EHTH Price Target
For more insight on analysts targets of EHTH, see our EHTH price target page. And for a list of of all stocks sorted by upside potential based on analyst target price, see our Top Price Target page.
Average Price Target | $78.33 | Average Broker Recommendation | 1.64 (Moderate Buy) |
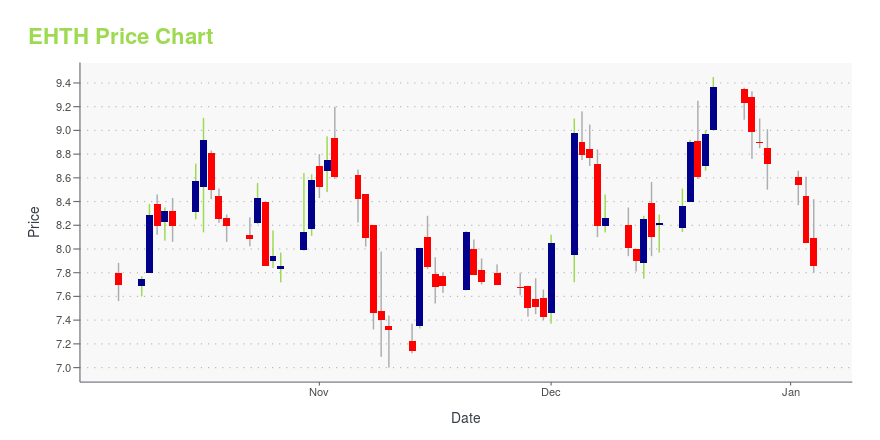
EHTH Stock Price Chart Interactive Chart >
EHTH Price/Volume Stats
Current price | $7.72 | 52-week high | $19.16 |
Prev. close | $7.41 | 52-week low | $2.67 |
Day low | $7.29 | Volume | 478,931 |
Day high | $7.82 | Avg. volume | 1,134,516 |
50-day MA | $5.43 | Dividend yield | N/A |
200-day MA | $6.66 | Market Cap | 211.70M |
eHealth, Inc. (EHTH) Company Bio
eHealth Inc. provides e-commerce platforms to organize and present health insurance information in various formats that enable individuals, families, and small businesses to research, analyze, compare, and purchase a range of health insurance plans. The company was founded in 1997 and is based in Mountain View, California.
Latest EHTH News From Around the Web
Below are the latest news stories about EHEALTH INC that investors may wish to consider to help them evaluate EHTH as an investment opportunity.
eHealth Inc. (EHTH) did well last session?eHealth Inc. (NASDAQ:EHTH) marked $8.01 per share on Monday, up from a previous closing price of $7.84. While eHealth Inc. has overperformed by 2.17%, investors are advised to look at stock chart patterns for technical insight. Within its last year performance, EHTH fell by -61.97%, with highs and lows ranging from $22.25 to $2.67, whereas […] |
SoFi Technologies, Cincinnati Financial, eHealth among financials gainersGainers: SoFi Technologies (SOFI) +16%. Applied Digital (APLD) +7%. Cincinnati Financial (CINF) +6%. eHealth (EHTH) +6%.Losers: HomeStreet (HMST) -12%. |
eHealth, Inc. to Hold Fourth Quarter and Fiscal Year 2022 Earnings Call on February 28 at 8:30 a.m. Eastern TimeeHealth, Inc. (Nasdaq: EHTH), a leading private online health insurance marketplace, today announced that the company plans to release fourth quarter and fiscal year 2022 financial results on February 28, 2023. |
Shocking stocks: eHealth, Inc. (NASDAQ:EHTH -0.98%), Altisource Portfolio Solutions S.A. (NASDAQ:ASPS -23.54%)EHTH has seen its SMA50 which is now 50.71%. In looking the SMA 200 we see that the stock has seen a 5.42%. ASPS has seen its SMA50 which is … The post Shocking stocks: eHealth, Inc. (NASDAQ:EHTH -0.98%), Altisource Portfolio Solutions S.A. (NASDAQ:ASPS -23.54%) appeared first on Stocks Equity . |
Indicators from Technical Perspective: eHealth, Inc. (NASDAQ:EHTH 32.29%), Camber Energy, Inc. (AMEX:CEI -8.72%)EHTH has seen its SMA50 which is now 54.24%. In looking the SMA 200 we see that the stock has seen a 6.14%. CEI has seen its SMA50 which is … The post Indicators from Technical Perspective: eHealth, Inc. (NASDAQ:EHTH 32.29%), Camber Energy, Inc. (AMEX:CEI -8.72%) appeared first on Stocks Equity . |
EHTH Price Returns
1-mo | 37.61% |
3-mo | 104.23% |
6-mo | -1.40% |
1-year | -59.37% |
3-year | -93.21% |
5-year | -51.63% |
YTD | 59.50% |
2022 | -81.02% |
2021 | -63.89% |
2020 | -26.51% |
2019 | 150.08% |
2018 | 121.19% |
Continue Researching EHTH
Want to do more research on eHealth Inc's stock and its price? Try the links below:eHealth Inc (EHTH) Stock Price | Nasdaq
eHealth Inc (EHTH) Stock Quote, History and News - Yahoo Finance
eHealth Inc (EHTH) Stock Price and Basic Information | MarketWatch
Loading social stream, please wait...