Employers Holdings Inc (EIG): Price and Financial Metrics
EIG Price/Volume Stats
Current price | $45.39 | 52-week high | $46.78 |
Prev. close | $45.01 | 52-week low | $35.43 |
Day low | $45.12 | Volume | 155,600 |
Day high | $45.59 | Avg. volume | 140,470 |
50-day MA | $43.49 | Dividend yield | 2.53% |
200-day MA | $39.91 | Market Cap | 1.15B |
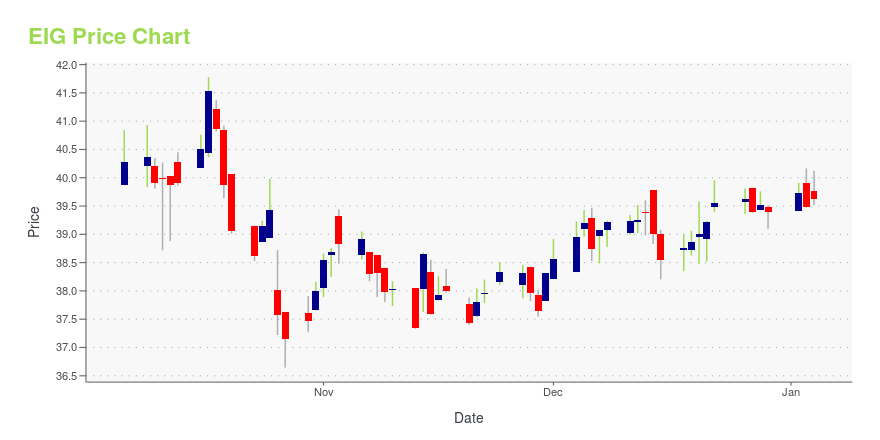
EIG Stock Price Chart Interactive Chart >
EIG POWR Grades
- EIG scores best on the Momentum dimension, with a Momentum rank ahead of 90.65% of US stocks.
- The strongest trend for EIG is in Growth, which has been heading down over the past 26 weeks.
- EIG ranks lowest in Growth; there it ranks in the 4th percentile.
EIG Stock Summary
- With a year-over-year growth in debt of -76.88%, EMPLOYERS HOLDINGS INC's debt growth rate surpasses merely 2.26% of about US stocks.
- The volatility of EMPLOYERS HOLDINGS INC's share price is greater than that of merely 2.58% US stocks with at least 200 days of trading history.
- Shareholder yield, a measure of how much is returned to shareholders via dividends and share repurchases, for EIG comes in at 26.59% -- higher than that of 93.42% of stocks in our set.
- Stocks that are quantitatively similar to EIG, based on their financial statements, market capitalization, and price volatility, are PLUS, LSEA, WEYS, VIRC, and JBT.
- EIG's SEC filings can be seen here. And to visit EMPLOYERS HOLDINGS INC's official web site, go to www.employers.com.
EIG Valuation Summary
- EIG's price/earnings ratio is 8.5; this is 22.73% lower than that of the median Financial Services stock.
- Over the past 206 months, EIG's price/sales ratio has gone down 0.9.
Below are key valuation metrics over time for EIG.
Stock | Date | P/S | P/B | P/E | EV/EBIT |
---|---|---|---|---|---|
EIG | 2023-12-22 | 1.2 | 1.1 | 8.5 | 6.2 |
EIG | 2023-12-21 | 1.2 | 1.1 | 8.4 | 6.2 |
EIG | 2023-12-20 | 1.2 | 1.1 | 8.4 | 6.1 |
EIG | 2023-12-19 | 1.2 | 1.1 | 8.4 | 6.1 |
EIG | 2023-12-18 | 1.2 | 1.1 | 8.3 | 6.1 |
EIG | 2023-12-15 | 1.2 | 1.1 | 8.3 | 6.1 |
EIG Growth Metrics
- Its 3 year price growth rate is now at -11.56%.
- Its 3 year cash and equivalents growth rate is now at 37.87%.
- Its year over year cash and equivalents growth rate is now at 52.69%.
The table below shows EIG's growth in key financial areas (numbers in millions of US dollars).
Date | Revenue | Operating Cash Flow | Net Income to Common Stock |
---|---|---|---|
2022-12-31 | 713.5 | 99.8 | 48.4 |
2022-09-30 | 691.5 | 87.6 | 56 |
2022-06-30 | 655.4 | 74 | 51.9 |
2022-03-31 | 691.5 | 39 | 93.9 |
2021-12-31 | 703.1 | 10.8 | 119.3 |
2021-09-30 | 694.4 | -23.6 | 128.5 |
EIG's Quality Factors
The “Quality” component of the POWR Ratings focuses on 31 different factors of a companies fundamentals and operational strength. Here are some key insights as we drill into the specifics of these quality attributes.- EIG has a Quality Grade of C, ranking ahead of 57.63% of graded US stocks.
- EIG's asset turnover comes in at 0.18 -- ranking 90th of 133 Insurance stocks.
- AMSF, CNC, and CI are the stocks whose asset turnover ratios are most correlated with EIG.
The table below shows EIG's key quality metrics over time.
Period | Asset Turnover | Gross Margin | ROIC |
---|---|---|---|
2021-09-30 | 0.180 | 0.579 | 0.043 |
2021-06-30 | 0.181 | 0.607 | 0.048 |
2021-03-31 | 0.190 | 0.642 | 0.058 |
2020-12-31 | 0.180 | 0.575 | 0.039 |
2020-09-30 | 0.184 | 0.518 | 0.029 |
2020-06-30 | 0.188 | 0.509 | 0.029 |
EIG Price Target
For more insight on analysts targets of EIG, see our EIG price target page. And for a list of of all stocks sorted by upside potential based on analyst target price, see our Top Price Target page.
Average Price Target | $49.50 | Average Broker Recommendation | 1.75 (Moderate Buy) |
Employers Holdings Inc (EIG) Company Bio
Employers Holdings Inc. operates in the commercial property and casualty insurance industry in the United States. It provides workers compensation insurance coverage to small businesses in low to medium hazard industries. was founded in 2000 and is founded in Reno, Nevada.
Latest EIG News From Around the Web
Below are the latest news stories about EMPLOYERS HOLDINGS INC that investors may wish to consider to help them evaluate EIG as an investment opportunity.
This Employers Holdings Insider Increased Their Holding By 16% Last YearLooking at Employers Holdings, Inc.'s ( NYSE:EIG ) insider transactions over the last year, we can see that insiders... |
Why RenaissanceRe (RNR) Shares Are Attracting Investors NowRenaissanceRe's (RNR) increasing returns from fixed maturity and short-term portfolios are expected to benefit its net investment income. |
Here's Why AON Shares are Attracting Prudent Investors NowAON's Reinsurance Solutions and Commercial Risk Solutions businesses are likely to play major roles in top-line growth. |
HCI Group's (HCI) HCPCI Takes Over 53,000 Policies From CitizensThe assumed policies by HCI Group's (HCI) subsidiary, HCPCI, represent an in-force premium of around $196 million. |
Declining Stock and Decent Financials: Is The Market Wrong About Employers Holdings, Inc. (NYSE:EIG)?It is hard to get excited after looking at Employers Holdings' (NYSE:EIG) recent performance, when its stock has... |
EIG Price Returns
1-mo | -0.57% |
3-mo | 15.90% |
6-mo | 15.14% |
1-year | 12.41% |
3-year | 19.59% |
5-year | 35.74% |
YTD | 15.90% |
2023 | -6.10% |
2022 | 12.57% |
2021 | 31.88% |
2020 | -20.54% |
2019 | 1.59% |
EIG Dividends
Ex-Dividend Date | Type | Payout Amount | Change | ||||||
---|---|---|---|---|---|---|---|---|---|
Loading, please wait... |
Continue Researching EIG
Want to see what other sources are saying about Employers Holdings Inc's financials and stock price? Try the links below:Employers Holdings Inc (EIG) Stock Price | Nasdaq
Employers Holdings Inc (EIG) Stock Quote, History and News - Yahoo Finance
Employers Holdings Inc (EIG) Stock Price and Basic Information | MarketWatch
Loading social stream, please wait...