
Electromed, Inc. (ELMD): Price and Financial Metrics
ELMD Price/Volume Stats
| Current price | $15.28 | 52-week high | $18.60 |
| Prev. close | $14.79 | 52-week low | $8.80 |
| Day low | $14.58 | Volume | 30,600 |
| Day high | $15.52 | Avg. volume | 28,845 |
| 50-day MA | $15.09 | Dividend yield | N/A |
| 200-day MA | $13.33 | Market Cap | 132.26M |
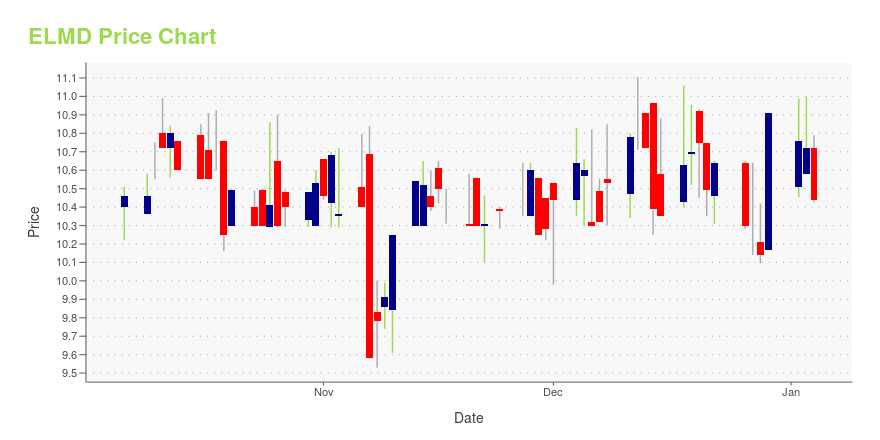
ELMD Stock Price Chart Interactive Chart >
Electromed, Inc. (ELMD) Company Bio
Electromed, Inc. develops, manufactures, markets, and sells airway clearance therapy and related products that apply high frequency chest wall oscillation (HFCWO) therapy in pulmonary care for patients of all ages in the United States and internationally. The company offers SmartVest airway clearance system; SmartVest SQL System that consists of an inflatable therapy garment, a programmable air pulse generator, and a patented single-hose that delivers air pulses from the generator to the garment; and SmartVest Connect, a wireless technology with personalized HFCWO therapy management portal for patients with compromised pulmonary function. It also provides single patient use SmartVest and SmartVest Wrap products for health care providers in the acute care setting. The company offers its products primarily to home health care market for patients with bronchiectasis, cystic fibrosis, and neuromuscular disease. Electromed, Inc. markets its products primarily to physicians and health care providers, as well as directly to patients. The company was founded in 1992 and is headquartered in New Prague, Minnesota.
Latest ELMD News From Around the Web
Below are the latest news stories about ELECTROMED INC that investors may wish to consider to help them evaluate ELMD as an investment opportunity.
Electromed, Inc. Announces Fiscal 2024 First Quarter Financial ResultsNEW PRAGUE, Minn., November 07, 2023--Electromed, Inc. Announces Fiscal 2024 First Quarter Financial Results |
Electromed, Inc. Announces Hospital Market Release SmartVest Clearway, Fifth Generation HFCWO Airway Clearance GeneratorNEW PRAGUE, Minn., November 01, 2023--Electromed, Inc. Announces Hospital Market Release SmartVest Clearway, Fifth Generation HFCWO Airway Clearance Generator |
Electromed, Inc. to Participate in the Canaccord Genuity MedTech, Diagnostics and Digital Health & Services ForumNEW PRAGUE, Minn., November 01, 2023--Electromed, Inc. to Participate in the Canaccord Genuity MedTech, Diagnostics and Digital Health & Services Forum |
Electromed, Inc. Schedules its First Quarter Fiscal 2024 Financial Results Conference Call for November 7, 2023 at 5:00 p.m. ETNEW PRAGUE, Minn., October 24, 2023--Electromed, Inc. Schedules its First Quarter Fiscal 2024 Financial Results Conference Call for November 7, 2023 at 5:00 p.m. ET |
Electromed, Inc. Announces Fiscal 2023 Fourth Quarter and Full Year Financial ResultsNEW PRAGUE, Minn., August 22, 2023--Electromed, Inc. Announces Fiscal 2023 Fourth Quarter and Full Year Financial Results |
ELMD Price Returns
| 1-mo | 5.02% |
| 3-mo | -3.11% |
| 6-mo | 47.21% |
| 1-year | 44.15% |
| 3-year | 25.45% |
| 5-year | 184.54% |
| YTD | 40.05% |
| 2023 | 4.00% |
| 2022 | -19.31% |
| 2021 | 32.52% |
| 2020 | 13.41% |
| 2019 | 69.94% |
Continue Researching ELMD
Want to see what other sources are saying about Electromed Inc's financials and stock price? Try the links below:Electromed Inc (ELMD) Stock Price | Nasdaq
Electromed Inc (ELMD) Stock Quote, History and News - Yahoo Finance
Electromed Inc (ELMD) Stock Price and Basic Information | MarketWatch
Loading social stream, please wait...