
eMagin Corporation (EMAN): Price and Financial Metrics
EMAN Price/Volume Stats
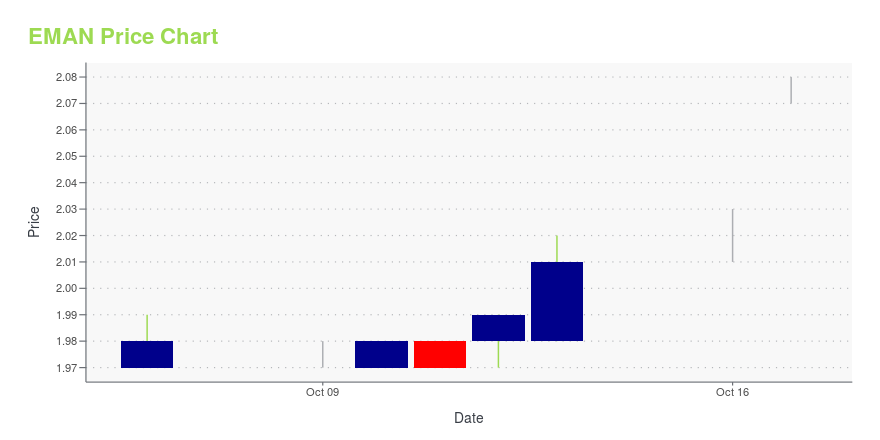
| Current price | $2.07 | 52-week high | $2.49 |
| Prev. close | $2.01 | 52-week low | $0.69 |
| Day low | $2.07 | Volume | 3,585,200 |
| Day high | $2.08 | Avg. volume | 670,070 |
| 50-day MA | $1.98 | Dividend yield | N/A |
| 200-day MA | $1.73 | Market Cap | 172.20M |
EMAN Stock Price Chart Interactive Chart >
eMagin Corporation (EMAN) Company Bio
eMagin Corporation designs, develops, manufactures, and markets organic light emitting diode (OLED) on silicon micro displays; virtual imaging products that utilize OLED micro displays; and related products. The company was founded in 1993 and is based in Hopewell Junction, New York.
Latest EMAN News From Around the Web
Below are the latest news stories about EMAGIN CORP that investors may wish to consider to help them evaluate EMAN as an investment opportunity.
eMagin Stockholders Approve Acquisition by Samsung DisplayHOPEWELL JUNCTION, N.Y., Aug. 31, 2023 (GLOBE NEWSWIRE) -- eMagin Corporation (NYSE American: EMAN) (“eMagin” or the “Company”), a U.S.-based leader in the development, design, and manufacture of Active-Matrix OLED microdisplays for high-resolution, AR/VR and other near-eye imaging products, today announced that its stockholders voted to approve eMagin’s pending acquisition by Samsung Display Co., Ltd. (“Samsung Display”), a subsidiary of Samsung Electronics Co., Ltd. and manufacturer and distri |
Independent Proxy Advisory Firms ISS and Glass Lewis Recommend eMagin Shareholders Vote “For” Proposed Transaction with Samsung DisplayISS Recommendation FOR Transaction Based on eMagin Having Secured Multiple Offer Increases, a Share Premium, and Downside Risks to Non-Approval Glass Lewis Recommendation FOR Transaction Based on eMagin’s Efforts to Provide Greater Value for Investors and Lack of Expectation That a Higher Offer Will Materialize eMagin Shareholders are Encouraged to Vote FOR Transaction Ahead of the August 31 Special Meeting of Shareholders at 9 a.m. ET HOPEWELL JUNCTION, N.Y., Aug. 21, 2023 (GLOBE NEWSWIRE) -- e |
eMagin Corporation (AMEX:EMAN) Q2 2023 Earnings Call TranscripteMagin Corporation (AMEX:EMAN) Q2 2023 Earnings Call Transcript August 10, 2023 eMagin Corporation misses on earnings expectations. Reported EPS is $-0.04 EPS, expectations were $-0.03. Operator: Good morning, and welcome to the eMagin Corporation’s Second Quarter 2023 Earnings Conference Call. Please note, this event is being recorded. I will now turn the conference over to […] |
Q2 2023 eMagin Corp Earnings CallQ2 2023 eMagin Corp Earnings Call |
EMagin (EMAN) Reports Q2 Loss, Lags Revenue EstimateseMagin (EMAN) delivered earnings and revenue surprises of -33.33% and 29.21%, respectively, for the quarter ended June 2023. Do the numbers hold clues to what lies ahead for the stock? |
EMAN Price Returns
| 1-mo | N/A |
| 3-mo | N/A |
| 6-mo | N/A |
| 1-year | 3.50% |
| 3-year | -25.54% |
| 5-year | 391.69% |
| YTD | N/A |
| 2023 | 0.00% |
| 2022 | -34.11% |
| 2021 | -21.82% |
| 2020 | 379.93% |
| 2019 | -66.62% |
Continue Researching EMAN
Want to do more research on Emagin Corp's stock and its price? Try the links below:Emagin Corp (EMAN) Stock Price | Nasdaq
Emagin Corp (EMAN) Stock Quote, History and News - Yahoo Finance
Emagin Corp (EMAN) Stock Price and Basic Information | MarketWatch
Loading social stream, please wait...