
Embecta Corp., (EMBC): Price and Financial Metrics
EMBC Price/Volume Stats
| Current price | $15.57 | 52-week high | $23.75 |
| Prev. close | $15.87 | 52-week low | $9.93 |
| Day low | $15.42 | Volume | 428,768 |
| Day high | $16.09 | Avg. volume | 427,874 |
| 50-day MA | $13.07 | Dividend yield | 3.7% |
| 200-day MA | $14.57 | Market Cap | 897.92M |
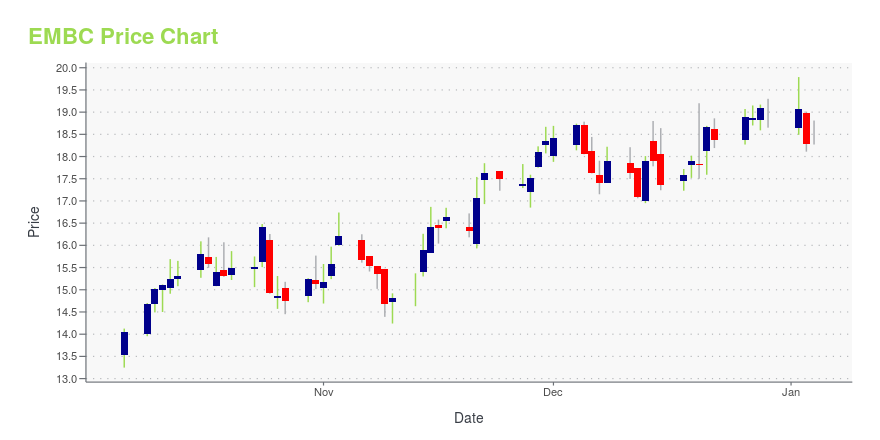
EMBC Stock Price Chart Interactive Chart >
Embecta Corp., (EMBC) Company Bio
Embecta Corp., a medical device company, focuses on the provision of various solutions to enhance the health and wellbeing of people living with diabetes. Its products include pen needles, syringes, and safety devices, as well as digital applications to assist people with managing their diabetes. The company primarily sells its products to wholesalers and distributors in the United States and internationally. Embecta Corp. was founded in 1924 and is based in Parsippany, New Jersey. Embecta Corp.(NasdaqGS:EMBC) operates independently of Becton, Dickinson and Company as of April 1, 2022.
Latest EMBC News From Around the Web
Below are the latest news stories about EMBECTA CORP that investors may wish to consider to help them evaluate EMBC as an investment opportunity.
Zacks Investment Ideas feature highlights: Beacon Roofing Supply, Embecta and Western Midstream PartnersBeacon Roofing Supply, Embecta and Western Midstream Partners have been highlighted in this Investment Ideas article. |
Time to Buy These Intriguing Additions to Zacks Rank #1 (Strong Buy) ListSeveral intriguing stocks were recently added to the Zacks Rank #1 (Strong Buy) list this week and shouldn't be overlooked as we round out what has been an exciting year for the stock market. |
embecta to Participate at the 42nd Annual J.P. Morgan Healthcare ConferencePARSIPPANY, N.J., Dec. 14, 2023 (GLOBE NEWSWIRE) -- Embecta Corp. (embecta) (Nasdaq: EMBC) today announced that management will present at the J.P. Morgan Healthcare Conference in San Francisco on Wednesday, January 10, 2024 at 2:15 p.m. PT / 5:15 p.m. ET. Audio webcasts of the presentations will be accessible under the “News & Events” section of the Company's investor relations website at investors.embecta.com. About embecta embecta is a global diabetes care company that is leveraging its nearl |
No embecta-made syringes impacted by FDA safety communicationPARSIPPANY, N.J., Dec. 01, 2023 (GLOBE NEWSWIRE) -- Embecta Corp. (“embecta”) (Nasdaq: EMBC), a global diabetes care company, today issued the following statement regarding the U.S. Food and Drug Administration (FDA) Safety Communication on evaluation of certain plastic syringes: “embecta, the world’s largest manufacturer of plastic insulin syringes, manufactures all of our syringes distributed worldwide at our facility in Holdrege, Nebraska,” said Shaun Curtis, SVP, Global Manufacturing & Suppl |
Embecta Corp's Dividend AnalysisEmbecta Corp(NASDAQ:EMBC) recently announced a dividend of $0.15 per share, payable on 2023-12-15, with the ex-dividend date set for 2023-12-01. As investors look forward to this upcoming payment, the spotlight also shines on the company's dividend history, yield, and growth rates. Using the data from GuruFocus, let's look into Embecta Corps dividend performance and assess its sustainability. |
EMBC Price Returns
| 1-mo | 26.89% |
| 3-mo | 52.78% |
| 6-mo | -8.00% |
| 1-year | -23.66% |
| 3-year | N/A |
| 5-year | N/A |
| YTD | -15.92% |
| 2023 | -23.11% |
| 2022 | N/A |
| 2021 | N/A |
| 2020 | N/A |
| 2019 | N/A |
EMBC Dividends
| Ex-Dividend Date | Type | Payout Amount | Change | ||||||
|---|---|---|---|---|---|---|---|---|---|
| Loading, please wait... | |||||||||
Loading social stream, please wait...