
EMCOR Group, Inc. (EME): Price and Financial Metrics
EME Price/Volume Stats
| Current price | $364.05 | 52-week high | $401.98 |
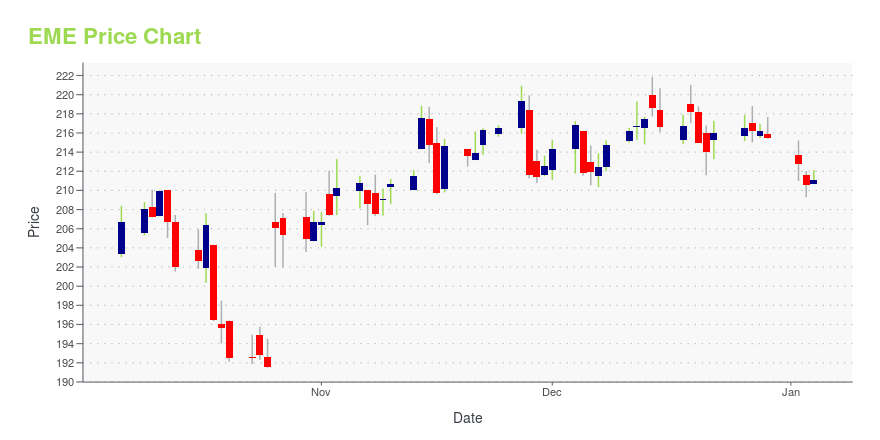
| Prev. close | $346.60 | 52-week low | $191.50 |
| Day low | $351.91 | Volume | 1,229,635 |
| Day high | $368.08 | Avg. volume | 473,043 |
| 50-day MA | $376.39 | Dividend yield | 0.26% |
| 200-day MA | $292.94 | Market Cap | 17.11B |
EME Stock Price Chart Interactive Chart >
EMCOR Group, Inc. (EME) Company Bio
Emcor Group provides electrical and mechanical construction and facilities services to commercial, industrial, utility, and institutional customers in the United States. The company was founded in 1966 and is based in Norwalk, Connecticut.
Latest EME News From Around the Web
Below are the latest news stories about EMCOR GROUP INC that investors may wish to consider to help them evaluate EME as an investment opportunity.
Emcor Group (EME) is on the Move, Here's Why the Trend Could be SustainableEmcor Group (EME) could be a great choice for investors looking to make a profit from fundamentally strong stocks that are currently on the move. It is one of the several stocks that made it through our "Recent Price Strength" screen. |
EMCOR (EME) Up 46% This Year: Will the Rally Continue in 2024?With a resilient U.S. Construction segment and strategic acquisitions, EMCOR (EME) is poised for continued success in diverse markets. |
Zacks.com featured highlights include EMCOR Group, Arcos Dorados, Photronics and CiveoEMCOR Group, Arcos Dorados, Photronics and Civeo are part of the Zacks Screen of the Week article. |
EMCOR Group (NYSE:EME) Knows How To Allocate Capital EffectivelyIf we want to find a stock that could multiply over the long term, what are the underlying trends we should look for... |
CRH's Oldcastle Acquires Waupaca Northwoods' Nampa FacilityCRH's Oldcastle APG's acquisition of Waupaca Northwoods facility in Nampa aligns with its footprint expansion strategy. |
EME Price Returns
| 1-mo | -1.15% |
| 3-mo | 2.90% |
| 6-mo | 62.59% |
| 1-year | 82.07% |
| 3-year | 202.68% |
| 5-year | 341.96% |
| YTD | 69.36% |
| 2023 | 46.03% |
| 2022 | 16.81% |
| 2021 | 39.93% |
| 2020 | 6.47% |
| 2019 | 45.18% |
EME Dividends
| Ex-Dividend Date | Type | Payout Amount | Change | ||||||
|---|---|---|---|---|---|---|---|---|---|
| Loading, please wait... | |||||||||
Continue Researching EME
Here are a few links from around the web to help you further your research on EMCOR Group Inc's stock as an investment opportunity:EMCOR Group Inc (EME) Stock Price | Nasdaq
EMCOR Group Inc (EME) Stock Quote, History and News - Yahoo Finance
EMCOR Group Inc (EME) Stock Price and Basic Information | MarketWatch
Loading social stream, please wait...