Eastern Company (The) (EML): Price and Financial Metrics

Eastern Company (The) (EML): $18.16

0.01 (+0.06%)

POWR Rating

Component Grades

Momentum

C

Stability

B

Sentiment

Quality

C

Add EML to Watchlist
Sign Up

Industry: Industrial - Equipment

Industry

B

Ranked

#15 of 91

in industry

EML Price/Volume Stats

Current price $18.16 52-week high $24.35
Prev. close $18.15 52-week low $15.30
Day low $18.01 Volume 6,169
Day high $18.16 Avg. volume 7,347
50-day MA $17.75 Dividend yield 2.38%
200-day MA $18.22 Market Cap 113.28M

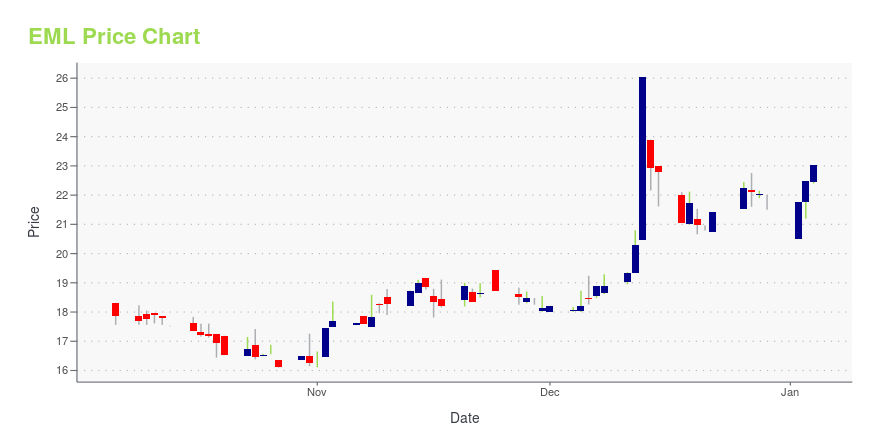
EML Stock Price Chart Interactive Chart >

EML POWR Grades

  • Stability is the dimension where EML ranks best; there it ranks ahead of 89.41% of US stocks.
  • The strongest trend for EML is in Quality, which has been heading up over the past 57 days.
  • EML ranks lowest in Growth; there it ranks in the 24th percentile.

EML Stock Summary

  • EML's price/sales ratio is 0.41; that's higher than the P/S ratio of just 16.19% of US stocks.
  • With a year-over-year growth in debt of -25.39%, EASTERN CO's debt growth rate surpasses only 13.19% of about US stocks.
  • Shareholder yield, a measure of how much is returned to shareholders via dividends and share repurchases, for EML comes in at 24.62% -- higher than that of 91.89% of stocks in our set.
  • Stocks that are quantitatively similar to EML, based on their financial statements, market capitalization, and price volatility, are REZI, TNC, ORGO, MYO, and OFLX.
  • Visit EML's SEC page to see the company's official filings. To visit the company's web site, go to www.easterncompany.com.

EML Valuation Summary

  • EML's price/sales ratio is 0.4; this is 77.14% lower than that of the median Industrials stock.
  • Over the past 243 months, EML's price/sales ratio has gone down 0.2.

Below are key valuation metrics over time for EML.

Stock Date P/S P/B P/E EV/EBIT
EML 2023-11-09 0.4 0.9 20.9 17.2
EML 2023-11-08 0.4 0.9 20.4 16.9
EML 2023-11-07 0.4 0.9 20.2 16.8
EML 2023-11-06 0.4 0.9 15.2 14.3
EML 2023-11-03 0.4 0.9 15.3 14.3
EML 2023-11-02 0.4 0.9 15.0 14.2

EML Growth Metrics

    Its 2 year price growth rate is now at 27.14%.
  • The 3 year net income to common stockholders growth rate now stands at -49.72%.
  • The year over year net cashflow from operations growth rate now stands at -163.02%.
EML's revenue has moved up $18,073,722 over the prior 33 months.

The table below shows EML's growth in key financial areas (numbers in millions of US dollars).

Date Revenue Operating Cash Flow Net Income to Common Stock
2022-09-30 269.8163 -4.763067 13.93178
2022-06-30 262.0565 -14.52645 15.03473
2022-03-31 253.764 -13.41396 6.524343
2021-12-31 246.5228 -7.757423 9.349171
2021-09-30 258.6609 0.680674 8.742394
2021-06-30 260.5896 17.59793 5.765541

EML's Quality Factors

The “Quality” component of the POWR Ratings focuses on 31 different factors of a companies fundamentals and operational strength. Here are some key insights as we drill into the specifics of these quality attributes.
  • EML has a Quality Grade of C, ranking ahead of 69.55% of graded US stocks.
  • EML's asset turnover comes in at 0.939 -- ranking 26th of 60 Construction Materials stocks.
  • PH, ACU, and SNA are the stocks whose asset turnover ratios are most correlated with EML.

The table below shows EML's key quality metrics over time.

Period Asset Turnover Gross Margin ROIC
2021-07-03 0.939 0.227 0.042
2021-04-03 0.903 0.225 0.058
2021-01-02 0.876 0.223 0.040
2020-10-03 0.902 0.234 0.061
2020-06-27 0.877 0.240 0.066
2020-03-28 1.000 0.245 0.100

Eastern Company (The) (EML) Company Bio


The Eastern Company is a manufacturer of industrial hardware, security products and metal castings. The company was founded in 1858 and is based in Naugatuck, Connecticut.


EML Latest News Stream


Event/Time News Detail
Loading, please wait...

EML Latest Social Stream


Loading social stream, please wait...

View Full EML Social Stream

Latest EML News From Around the Web

Below are the latest news stories about EASTERN CO that investors may wish to consider to help them evaluate EML as an investment opportunity.

Egypt Gets $625 Million Boost From Year’s Biggest Asset Sale

(Bloomberg) -- Egypt completed its biggest single asset sale this year by offloading about 30% of the country’s largest tobacco company for $625 million, part of a privatization push aimed at raising sorely needed hard currency. Most Read from BloombergAston Martin Owner Lawrence Stroll Sells F1 Team Stake at £1 Billion ValuationHamas Mastermind Who Tricked Israel Is Top Target in Gaza TunnelsApple Plans to Make It Easier to Text Between iPhones and Androids‘Fed-Friendly’ Data Lift Bonds as S&P

Yahoo | November 16, 2023

Sidoti Events, LLC’s Virtual November Micro-Cap Conference

NEW YORK, NY / ACCESSWIRE / November 14, 2023 / Sidoti Events, LLC, an affiliate of Sidoti & Company, LLC, has released the presentation schedule and weblinks for its two-day November Micro-Cap Conference taking place Wednesday and Thursday, November ...

Yahoo | November 14, 2023

The Eastern Company (NASDAQ:EML) Q3 2023 Earnings Call Transcript

The Eastern Company (NASDAQ:EML) Q3 2023 Earnings Call Transcript November 12, 2023 Operator: Greetings. And welcome to The Eastern Company’s Third Quarter of Fiscal Year 2023 Earnings Call. At this time, all participants are in a listen-only mode. A question-and-answer session will follow the formal presentation. [Operator Instructions] Please note, this conference is being recorded. […]

Yahoo | November 13, 2023

Independent Director of Eastern Picks Up 9.7% More Stock

Even if it's not a huge purchase, we think it was good to see that Frederick DiSanto, the Independent Director of The...

Yahoo | November 12, 2023

The Eastern Company (NASDAQ:EML) Looks Like A Good Stock, And It's Going Ex-Dividend Soon

The Eastern Company ( NASDAQ:EML ) is about to trade ex-dividend in the next 4 days. The ex-dividend date is usually...

Yahoo | November 9, 2023

Read More 'EML' Stories Here

EML Price Returns

1-mo 12.38%
3-mo 0.09%
6-mo 12.37%
1-year -19.19%
3-year -9.41%
5-year -26.69%
YTD -3.60%
2022 -21.55%
2021 5.66%
2020 -19.33%
2019 28.40%
2018 -6.06%

EML Dividends

Ex-Dividend Date Type Payout Amount Change
Loading, please wait...
View Full EML Dividend History

Get Free Updates

Join thousands of investors who get the latest news, insights and top rated picks from StockNews.com!