
Enfusion, Inc. (ENFN): Price and Financial Metrics
ENFN Price/Volume Stats
| Current price | $10.76 | 52-week high | $11.80 |
| Prev. close | $10.80 | 52-week low | $7.83 |
| Day low | $10.74 | Volume | 2,461,800 |
| Day high | $10.87 | Avg. volume | 1,209,081 |
| 50-day MA | $11.10 | Dividend yield | N/A |
| 200-day MA | $9.83 | Market Cap | 1.39B |
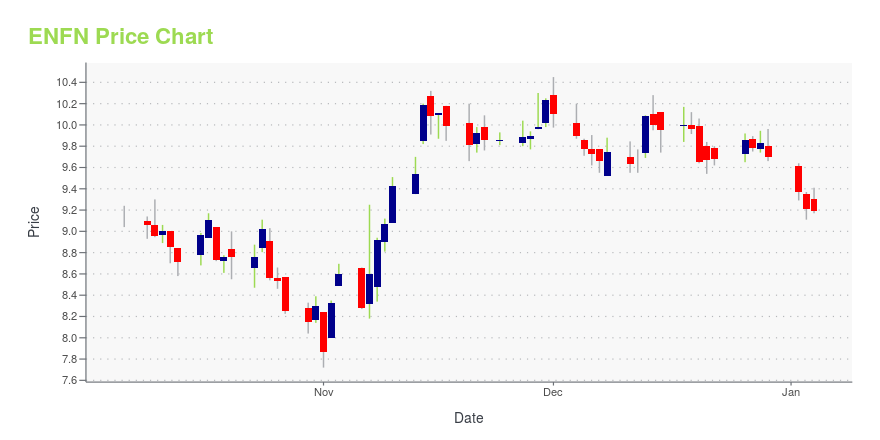
ENFN Stock Price Chart Interactive Chart >
Enfusion, Inc. (ENFN) Company Bio
Enfusion Inc. offers software-as-a-service for investment management industry in the United States, Europe, the Middle East, Africa, and the Asia Pacific. It provides portfolio management system, which generates a real-time investment book of record that consists of valuation and risk tools, which allows users to analyze aggregated or decomposed portfolio data for chief investment officers (CIOs) and portfolio managers; and order and execution management system that enables portfolio managers, traders, compliance teams, and analysts to electronically communicate trade orders for a variety of asset classes, manage trade orders, and systemically enforce trading regulations and internal guidelines. The company also offers accounting/general ledger system, a real-time accounting book of record for chief financial officers, chief operating officers, accountants, and operations teams; Enfusion analytics system, which enables CIOs, portfolio managers, traders, and analysts to analyze portfolios through time horizons and automate customized visualized reports for internal and external stakeholders; and technology-powered services. Enfusion Inc. was incorporated in 2021 and is headquartered in Chicago, Illinois.
ENFN Price Returns
| 1-mo | N/A |
| 3-mo | N/A |
| 6-mo | 11.62% |
| 1-year | 11.27% |
| 3-year | 18.37% |
| 5-year | N/A |
| YTD | 4.47% |
| 2024 | 6.19% |
| 2023 | 0.31% |
| 2022 | -53.82% |
| 2021 | N/A |
| 2020 | N/A |
Loading social stream, please wait...