
Enfusion, Inc. (ENFN): Price and Financial Metrics
ENFN Price/Volume Stats
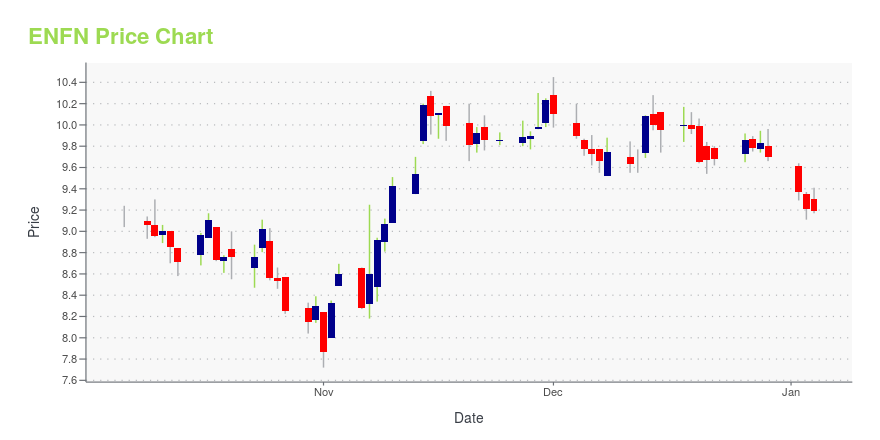
| Current price | $9.69 | 52-week high | $10.95 |
| Prev. close | $9.47 | 52-week low | $7.52 |
| Day low | $9.48 | Volume | 398,111 |
| Day high | $9.76 | Avg. volume | 365,422 |
| 50-day MA | $8.92 | Dividend yield | N/A |
| 200-day MA | $9.09 | Market Cap | 1.24B |
ENFN Stock Price Chart Interactive Chart >
Enfusion, Inc. (ENFN) Company Bio
Enfusion Inc. offers software-as-a-service for investment management industry in the United States, Europe, the Middle East, Africa, and the Asia Pacific. It provides portfolio management system, which generates a real-time investment book of record that consists of valuation and risk tools, which allows users to analyze aggregated or decomposed portfolio data for chief investment officers (CIOs) and portfolio managers; and order and execution management system that enables portfolio managers, traders, compliance teams, and analysts to electronically communicate trade orders for a variety of asset classes, manage trade orders, and systemically enforce trading regulations and internal guidelines. The company also offers accounting/general ledger system, a real-time accounting book of record for chief financial officers, chief operating officers, accountants, and operations teams; Enfusion analytics system, which enables CIOs, portfolio managers, traders, and analysts to analyze portfolios through time horizons and automate customized visualized reports for internal and external stakeholders; and technology-powered services. Enfusion Inc. was incorporated in 2021 and is headquartered in Chicago, Illinois.
Latest ENFN News From Around the Web
Below are the latest news stories about ENFUSION INC that investors may wish to consider to help them evaluate ENFN as an investment opportunity.
What You Can Learn From Enfusion, Inc.'s (NYSE:ENFN) P/SWith a median price-to-sales (or "P/S") ratio of close to 4.4x in the Software industry in the United States, you could... |
Hidden Gems: 3 Small-Cap Tech Stocks With Huge PotentialThese top small-cap tech stocks are the ones to buy in for long-term returns as profits are evident from innovations. |
META or ENFN: Which Is the Better Value Stock Right Now?META vs. ENFN: Which Stock Is the Better Value Option? |
Enfusion Announces Appointment of Chief Operating OfficerNEW YORK & LONDON & HONG KONG, November 20, 2023--Enfusion, Inc. ("Enfusion") (NYSE: ENFN), a leading provider of cloud-native software-as-a-service (SaaS) solutions for investment managers, announced today that it has appointed Neal Pawar to serve as Enfusion’s Chief Operating Officer (COO) effective November 27, 2023. |
Enfusion, Inc. (NYSE:ENFN) Q3 2023 Earnings Call TranscriptEnfusion, Inc. (NYSE:ENFN) Q3 2023 Earnings Call Transcript November 11, 2023 Operator: Good afternoon, ladies and gentlemen, and thank you for standing by. Welcome to Enfusion’s Third Quarter 2023 Earnings Conference Call. [Operator Instructions] As a reminder, this conference call is being recorded. I’d now like to turn the call over to Ignatius Njoku, Head […] |
ENFN Price Returns
| 1-mo | 15.36% |
| 3-mo | 2.87% |
| 6-mo | 14.95% |
| 1-year | -10.19% |
| 3-year | N/A |
| 5-year | N/A |
| YTD | -0.10% |
| 2023 | 0.31% |
| 2022 | -53.82% |
| 2021 | N/A |
| 2020 | N/A |
| 2019 | N/A |
Loading social stream, please wait...