Enphase Energy, Inc. (ENPH): Price and Financial Metrics
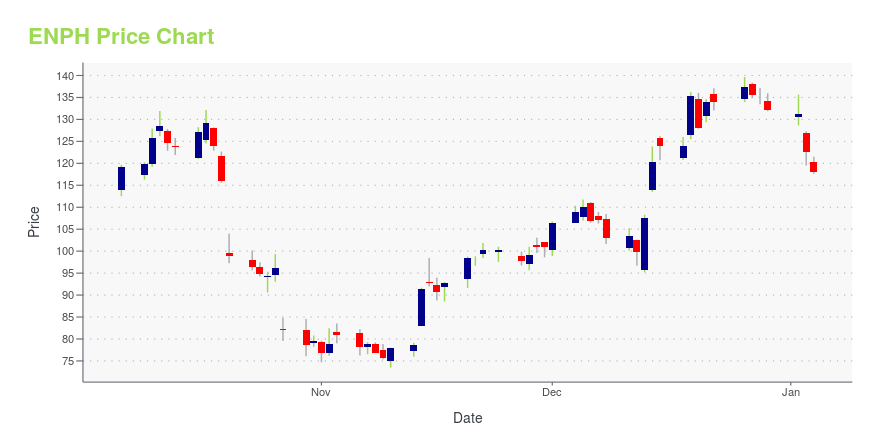
ENPH Price/Volume Stats
Current price | $123.55 | 52-week high | $339.92 |
Prev. close | $123.97 | 52-week low | $116.86 |
Day low | $122.17 | Volume | 1,500,687 |
Day high | $125.16 | Avg. volume | 3,987,493 |
50-day MA | $141.17 | Dividend yield | N/A |
200-day MA | $192.74 | Market Cap | 16.85B |
ENPH Stock Price Chart Interactive Chart >
ENPH POWR Grades
- Quality is the dimension where ENPH ranks best; there it ranks ahead of 98.48% of US stocks.
- ENPH's strongest trending metric is Growth; it's been moving down over the last 179 days.
- ENPH's current lowest rank is in the Stability metric (where it is better than 6.44% of US stocks).
ENPH Stock Summary
- ENPH has a market capitalization of $15,975,395,501 -- more than approximately 88.31% of US stocks.
- Over the past twelve months, ENPH has reported earnings growth of 163.55%, putting it ahead of 91.8% of US stocks in our set.
- Revenue growth over the past 12 months for ENPHASE ENERGY INC comes in at 61.11%, a number that bests 91.25% of the US stocks we're tracking.
- If you're looking for stocks that are quantitatively similar to ENPHASE ENERGY INC, a group of peers worth examining would be HOOD, NRGV, BHAT, TTD, and DDD.
- ENPH's SEC filings can be seen here. And to visit ENPHASE ENERGY INC's official web site, go to www.enphase.com.
ENPH Valuation Summary
- ENPH's EV/EBIT ratio is 25.8; this is 26.47% higher than that of the median Technology stock.
- Over the past 140 months, ENPH's price/earnings ratio has gone up 37.1.
Below are key valuation metrics over time for ENPH.
Stock | Date | P/S | P/B | P/E | EV/EBIT |
---|---|---|---|---|---|
ENPH | 2023-09-15 | 5.9 | 16.9 | 28.6 | 25.8 |
ENPH | 2023-09-14 | 6.0 | 17.1 | 29.1 | 26.2 |
ENPH | 2023-09-13 | 5.8 | 16.8 | 28.5 | 25.7 |
ENPH | 2023-09-12 | 6.0 | 17.3 | 29.4 | 26.4 |
ENPH | 2023-09-11 | 6.0 | 17.1 | 29.1 | 26.2 |
ENPH | 2023-09-08 | 5.9 | 16.9 | 28.6 | 25.8 |
ENPH Growth Metrics
- The 5 year net cashflow from operations growth rate now stands at 481.92%.
- The year over year net income to common stockholders growth rate now stands at 71.12%.
- Its 2 year price growth rate is now at 246.7%.

The table below shows ENPH's growth in key financial areas (numbers in millions of US dollars).
Date | Revenue | Operating Cash Flow | Net Income to Common Stock |
---|---|---|---|
2022-12-31 | 2,330.853 | 744.817 | 397.362 |
2022-09-30 | 2,018.92 | 588.276 | 296.2 |
2022-06-30 | 1,735.726 | 513.62 | 203.197 |
2022-03-31 | 1,521.587 | 378.63 | 165.572 |
2021-12-31 | 1,382.049 | 352.028 | 145.449 |
2021-09-30 | 1,234.169 | 339.035 | 165.849 |
ENPH's Quality Factors
The “Quality” component of the POWR Ratings focuses on 31 different factors of a companies fundamentals and operational strength. Here are some key insights as we drill into the specifics of these quality attributes.- ENPH has a Quality Grade of B, ranking ahead of 82.39% of graded US stocks.
- ENPH's asset turnover comes in at 0.639 -- ranking 116th of 208 Electronic Equipment stocks.
- PRKR, UI, and FKWL are the stocks whose asset turnover ratios are most correlated with ENPH.
The table below shows ENPH's key quality metrics over time.
Period | Asset Turnover | Gross Margin | ROIC |
---|---|---|---|
2021-09-30 | 0.639 | 0.416 | 0.152 |
2021-06-30 | 0.644 | 0.441 | 0.231 |
2021-03-31 | 0.635 | 0.446 | 0.139 |
2020-12-31 | 0.717 | 0.447 | 0.319 |
2020-09-30 | 0.751 | 0.420 | 0.249 |
2020-06-30 | 0.883 | 0.377 | 0.247 |
ENPH Price Target
For more insight on analysts targets of ENPH, see our ENPH price target page. And for a list of of all stocks sorted by upside potential based on analyst target price, see our Top Price Target page.
Average Price Target | $196.62 | Average Broker Recommendation | 1.57 (Moderate Buy) |
Enphase Energy, Inc. (ENPH) Company Bio
Enphase Energy, Inc., together with its subsidiaries, designs, develops, and sells microinverter systems for the solar photovoltaic industry in the United States and internationally. The company was founded in 2006 and is headquartered in Petaluma, California.
Latest ENPH News From Around the Web
Below are the latest news stories about ENPHASE ENERGY INC that investors may wish to consider to help them evaluate ENPH as an investment opportunity.
These Stocks Are Moving the Most Today: Instacart, Disney, NIO, Bausch Health, Enphase, U.S. Steel, Rocket Lab, and MoreInstacart opens for trading 40% above its IPO price, Disney aims to nearly double its investment in its parks, experiences, and products segment over the next decade, and NIO plans to raise $1 billion by issuing convertible senior notes. |
Markets Fall at Midday as Fed Meeting Kicks OffU.S. equities dropped at midday on Tuesday, Sept. 19, 2023, as the Fed kicked off its two-day policy meeting, with a decision on interest rates expected on Wednesday. |
Unveiling Enphase Energy (ENPH)'s Value: Is It Really Priced Right? A Comprehensive GuideAn in-depth analysis of the intrinsic value of Enphase Energy Inc. (ENPH) |
ENPH Stock Alert: Enphase Energy Announces Australian ExpansionAlthough Enphase Energy announced rising demand in Australia, ENPH stock is slipping, likely on the complexity of the prospect. |
Enphase Energy Inc (ENPH): A Deep Dive into Its Performance PotentialUnraveling the Factors That Could Limit Its Growth |
ENPH Price Returns
1-mo | -3.72% |
3-mo | -22.14% |
6-mo | -36.96% |
1-year | -59.43% |
3-year | 74.70% |
5-year | 2,707.95% |
YTD | -53.37% |
2022 | 44.83% |
2021 | 4.26% |
2020 | 571.53% |
2019 | 452.43% |
2018 | 96.27% |
Continue Researching ENPH
Here are a few links from around the web to help you further your research on Enphase Energy Inc's stock as an investment opportunity:Enphase Energy Inc (ENPH) Stock Price | Nasdaq
Enphase Energy Inc (ENPH) Stock Quote, History and News - Yahoo Finance
Enphase Energy Inc (ENPH) Stock Price and Basic Information | MarketWatch
Loading social stream, please wait...