
EnerSys (ENS): Price and Financial Metrics
ENS Price/Volume Stats
| Current price | $109.91 | 52-week high | $111.42 |
| Prev. close | $108.31 | 52-week low | $83.27 |
| Day low | $108.75 | Volume | 231,300 |
| Day high | $111.36 | Avg. volume | 241,871 |
| 50-day MA | $104.53 | Dividend yield | 0.82% |
| 200-day MA | $95.72 | Market Cap | 4.42B |
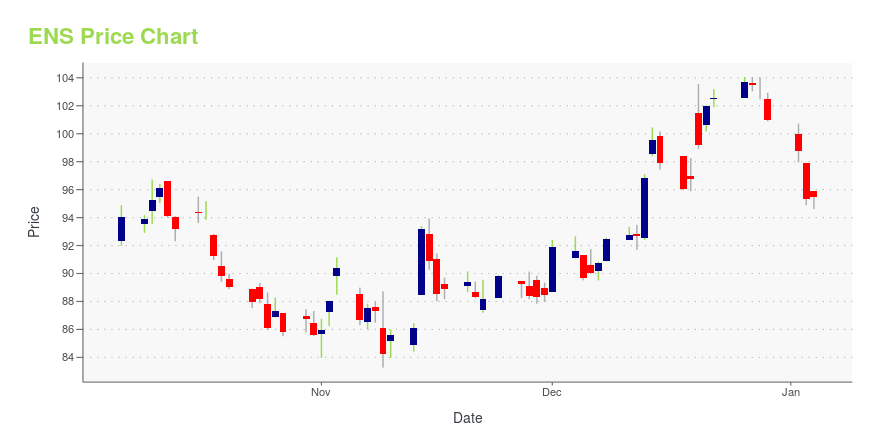
ENS Stock Price Chart Interactive Chart >
EnerSys (ENS) Company Bio
EnerSys manufactures and distributes reserve power and motive power batteries, battery chargers, power equipment, battery accessories and outdoor equipment enclosure solutions to customers worldwide. The company was founded in 1999 and is based in Reading, Pennsylvania.
Latest ENS News From Around the Web
Below are the latest news stories about ENERSYS that investors may wish to consider to help them evaluate ENS as an investment opportunity.
EnerSys (ENS) Gains From Business Strength Amid HeadwindsEnerSys (ENS) benefits from strength across end markets, solid product offerings and the IBCS buyout. However, the softness in its Energy Systems unit is concerning. |
EnerSys (ENS) Exceeds Market Returns: Some Facts to ConsiderEnerSys (ENS) reachead $102.55 at the closing of the latest trading day, reflecting a +0.58% change compared to its last close. |
EnerSys Stock Charged Up; Prepping For Run At All-Time High?EnerSys stock shows rising price performance, earning an upgrade to its IBD Relative Strength Rating. |
Enersys (ENS) Gives Update on IRC 45X Tax Benefits, Q3 View UpEnersys (ENS) updates its third-quarter fiscal 2024 outlook, taking into account the impacts of the U.S. Department of the Treasury's proposed regulations regarding Section 45X of the Internal Revenue Code. |
EnerSys Provides Update on IRC Section 45X Tax Credit Benefits and Updated Guidance for Its Fiscal Third Quarter 2024READING, Pa., December 19, 2023--EnerSys (NYSE: ENS) the global leader in stored energy solutions for industrial applications is providing a one time update to a portion of its previously issued fiscal third quarter 2024 outlook following the December 14, 2023 issuance of proposed regulations by the U.S. Department of the Treasury regarding the Advanced Manufacturing Production Credit - Section 45X of the Internal Revenue Code. The proposed regulations provide additional clarification on the met |
ENS Price Returns
| 1-mo | 7.82% |
| 3-mo | 20.67% |
| 6-mo | 13.85% |
| 1-year | 3.76% |
| 3-year | 18.65% |
| 5-year | 71.52% |
| YTD | 9.36% |
| 2023 | 37.90% |
| 2022 | -5.64% |
| 2021 | -4.04% |
| 2020 | 12.19% |
| 2019 | -2.57% |
ENS Dividends
| Ex-Dividend Date | Type | Payout Amount | Change | ||||||
|---|---|---|---|---|---|---|---|---|---|
| Loading, please wait... | |||||||||
Continue Researching ENS
Want to see what other sources are saying about EnerSys's financials and stock price? Try the links below:EnerSys (ENS) Stock Price | Nasdaq
EnerSys (ENS) Stock Quote, History and News - Yahoo Finance
EnerSys (ENS) Stock Price and Basic Information | MarketWatch
Loading social stream, please wait...