
Enova International, Inc. (ENVA): Price and Financial Metrics
ENVA Price/Volume Stats
| Current price | $81.91 | 52-week high | $82.29 |
| Prev. close | $81.07 | 52-week low | $35.30 |
| Day low | $78.54 | Volume | 550,800 |
| Day high | $82.29 | Avg. volume | 245,747 |
| 50-day MA | $63.57 | Dividend yield | N/A |
| 200-day MA | $56.71 | Market Cap | 2.31B |
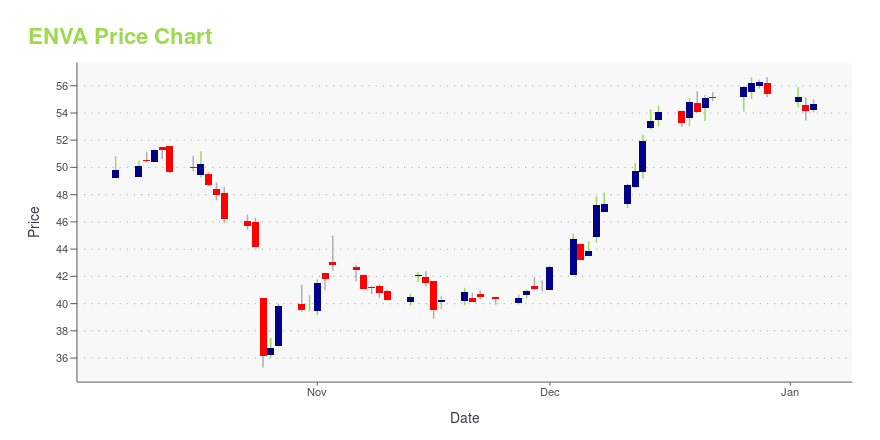
ENVA Stock Price Chart Interactive Chart >
Enova International, Inc. (ENVA) Company Bio
Enova International provides online financial services to alternative credit consumers in the United States, the United Kingdom, Australia, Canada, Brazil, and China. The company was founded in 2004 and is based in Chicago, Illinois.
Latest ENVA News From Around the Web
Below are the latest news stories about ENOVA INTERNATIONAL INC that investors may wish to consider to help them evaluate ENVA as an investment opportunity.
Should You Hold Enova International (ENVA)?Blue Tower Asset Management, an investment Management Company, released its third quarter, 2023 investor letter. A copy of the same can be downloaded here. In the quarter, the Blue Tower Global Value had a -2.19% return net of fees (-1.94% gross). The rates on US government treasuries rose sharply this quarter as the Federal Reserve pushed […] |
Further Upside For Enova International, Inc. (NYSE:ENVA) Shares Could Introduce Price Risks After 34% BounceEnova International, Inc. ( NYSE:ENVA ) shareholders would be excited to see that the share price has had a great... |
15 Quality Undervalued Non-Cyclical Stocks to Buy NowIn this article, we discuss the 15 quality undervalued non-cyclical stocks to buy now. If you want to read about some more non-cyclical undervalued stocks, go directly to 5 Quality Undervalued Non-Cyclical Stocks to Buy Now. The United States stock market has been on a roller coaster ride over the past few years. The pandemic […] |
Strength Seen in Capital One (COF): Can Its 3.3% Jump Turn into More Strength?Capital One (COF) witnessed a jump in share price last session on above-average trading volume. The latest trend in earnings estimate revisions for the stock doesn't suggest further strength down the road. |
Nasdaq Up Triple Digits; Dow Struggling To Keep UpStocks are mostly higher this afternoon, as Wall Street continues to sift through the latest jobless data ahead of tomorrow's highly anticipated jobs report. |
ENVA Price Returns
| 1-mo | 35.88% |
| 3-mo | 29.54% |
| 6-mo | 38.83% |
| 1-year | 49.63% |
| 3-year | 153.91% |
| 5-year | 208.51% |
| YTD | 47.96% |
| 2023 | 44.28% |
| 2022 | -6.32% |
| 2021 | 65.36% |
| 2020 | 2.95% |
| 2019 | 23.64% |
Continue Researching ENVA
Want to do more research on Enova International Inc's stock and its price? Try the links below:Enova International Inc (ENVA) Stock Price | Nasdaq
Enova International Inc (ENVA) Stock Quote, History and News - Yahoo Finance
Enova International Inc (ENVA) Stock Price and Basic Information | MarketWatch
Loading social stream, please wait...