EPAM Systems Inc. (EPAM): Price and Financial Metrics

EPAM Systems Inc. (EPAM): $276.37

7.97 (+2.97%)

POWR Rating

Component Grades

Momentum

C

Stability

C

Sentiment

Quality

B

Add EPAM to Watchlist
Sign Up

Industry: Technology - Services

Industry

C

Ranked

#43 of 81

in industry

EPAM Price/Volume Stats

Current price $276.37 52-week high $317.50
Prev. close $268.40 52-week low $197.99
Day low $270.95 Volume 577,200
Day high $276.53 Avg. volume 527,908
50-day MA $294.30 Dividend yield N/A
200-day MA $261.65 Market Cap 15.98B

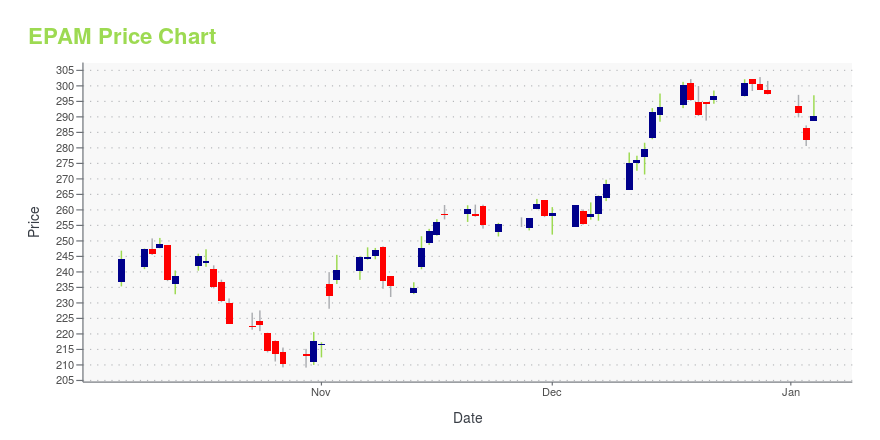
EPAM Stock Price Chart Interactive Chart >

EPAM POWR Grades

  • EPAM scores best on the Quality dimension, with a Quality rank ahead of 92.35% of US stocks.
  • The strongest trend for EPAM is in Stability, which has been heading up over the past 26 weeks.
  • EPAM's current lowest rank is in the Growth metric (where it is better than 9.18% of US stocks).

EPAM Stock Summary

  • EPAM has a market capitalization of $16,309,616,546 -- more than approximately 87.46% of US stocks.
  • The price/operating cash flow metric for EPAM SYSTEMS INC is higher than 85.13% of stocks in our set with a positive cash flow.
  • Equity multiplier, or assets relative to shareholders' equity, comes in at 1.29 for EPAM SYSTEMS INC; that's greater than it is for only 16.61% of US stocks.
  • If you're looking for stocks that are quantitatively similar to EPAM SYSTEMS INC, a group of peers worth examining would be EXLS, FDS, MEDP, WTTR, and DCO.
  • EPAM's SEC filings can be seen here. And to visit EPAM SYSTEMS INC's official web site, go to www.epam.com.

EPAM Valuation Summary

  • EPAM's price/earnings ratio is 32.6; this is 22.33% higher than that of the median Technology stock.
  • Over the past 144 months, EPAM's price/earnings ratio has gone down 7.2.

Below are key valuation metrics over time for EPAM.

Stock Date P/S P/B P/E EV/EBIT
EPAM 2023-12-08 3.3 4.7 32.6 22.6
EPAM 2023-12-07 3.2 4.6 32.1 22.2
EPAM 2023-12-06 3.1 4.5 31.5 21.7
EPAM 2023-12-05 3.1 4.5 31.0 21.4
EPAM 2023-12-04 3.2 4.6 31.8 21.9
EPAM 2023-12-01 3.1 4.5 31.5 21.7

EPAM Growth Metrics

    Its 2 year net cashflow from operations growth rate is now at 44.67%.
  • Its 2 year net income to common stockholders growth rate is now at 61.73%.
  • Its year over year net cashflow from operations growth rate is now at 2.77%.
EPAM's revenue has moved up $2,400,874,000 over the prior 34 months.

The table below shows EPAM's growth in key financial areas (numbers in millions of US dollars).

Date Revenue Operating Cash Flow Net Income to Common Stock
2022-12-31 4,824.698 464.104 419.416
2022-09-30 4,700.859 562.649 406.656
2022-06-30 4,462.478 516.331 366.258
2022-03-31 4,148.983 507.652 462.325
2021-12-31 3,758.144 572.327 481.652
2021-09-30 3,374.173 447.145 424.912

EPAM's Quality Factors

The “Quality” component of the POWR Ratings focuses on 31 different factors of a companies fundamentals and operational strength. Here are some key insights as we drill into the specifics of these quality attributes.
  • EPAM has a Quality Grade of B, ranking ahead of 88.15% of graded US stocks.
  • EPAM's asset turnover comes in at 1.103 -- ranking 108th of 561 Business Services stocks.
  • ACN, CRTO, and IPG are the stocks whose asset turnover ratios are most correlated with EPAM.

The table below shows EPAM's key quality metrics over time.

Period Asset Turnover Gross Margin ROIC
2021-06-30 1.103 0.344 0.463
2021-03-31 1.068 0.345 0.408
2020-12-31 1.066 0.349 0.379
2020-09-30 1.082 0.347 0.362
2020-06-30 1.115 0.349 0.349
2020-03-31 1.137 0.353 0.359

EPAM Systems Inc. (EPAM) Company Bio


EPAM Systems, Inc. ("Effective Programming for America") is an American company that specializes in service development, digital platform engineering, and digital product design, operating out of Newtown, Pennsylvania. (Source:Wikipedia)


EPAM Latest News Stream


Event/Time News Detail
Loading, please wait...

EPAM Latest Social Stream


Loading social stream, please wait...

View Full EPAM Social Stream

Latest EPAM News From Around the Web

Below are the latest news stories about EPAM SYSTEMS INC that investors may wish to consider to help them evaluate EPAM as an investment opportunity.

If You Invested $1000 in Epam a Decade Ago, This is How Much It'd Be Worth Now

Holding on to popular or trending stocks for the long-term can make your portfolio a winner.

Yahoo | December 21, 2023

EPAM Systems Inc CFO Jason Peterson Sells Company Shares

Jason Peterson, the CFO of EPAM Systems Inc (NYSE:EPAM), sold 900 shares of the company on December 18, 2023, according to a recent SEC Filing.

Yahoo | December 21, 2023

Is It Time To Consider Buying EPAM Systems, Inc. (NYSE:EPAM)?

EPAM Systems, Inc. ( NYSE:EPAM ) received a lot of attention from a substantial price increase on the NYSE over the...

Yahoo | December 17, 2023

Insider Sell: CFO Jason Peterson Sells Shares of EPAM Systems Inc

In the realm of stock market movements, insider trading activity is often a significant indicator that investors and analysts closely monitor.

Yahoo | December 16, 2023

EPAM Launches Open-Source DIAL Platform Based on Apache 2.0

EPAM unveils the open-source iteration of its Deterministic Integrator of Applications and Large Language Models ("DIAL") platform based on Apache 2.0 License.

Yahoo | December 14, 2023

Read More 'EPAM' Stories Here

EPAM Price Returns

1-mo -9.99%
3-mo -7.05%
6-mo 8.09%
1-year -3.29%
3-year -26.90%
5-year 63.41%
YTD -7.05%
2023 -9.28%
2022 -50.97%
2021 86.54%
2020 68.91%
2019 82.88%

Continue Researching EPAM

Here are a few links from around the web to help you further your research on EPAM Systems Inc's stock as an investment opportunity:

EPAM Systems Inc (EPAM) Stock Price | Nasdaq
EPAM Systems Inc (EPAM) Stock Quote, History and News - Yahoo Finance
EPAM Systems Inc (EPAM) Stock Price and Basic Information | MarketWatch

Get Free Updates

Join thousands of investors who get the latest news, insights and top rated picks from StockNews.com!