EPAM Systems Inc. (EPAM): Price and Financial Metrics
EPAM Price/Volume Stats
Current price | $258.25 | 52-week high | $385.96 |
Prev. close | $258.89 | 52-week low | $197.99 |
Day low | $254.51 | Volume | 139,857 |
Day high | $259.99 | Avg. volume | 506,310 |
50-day MA | $242.96 | Dividend yield | N/A |
200-day MA | $254.51 | Market Cap | 14.90B |
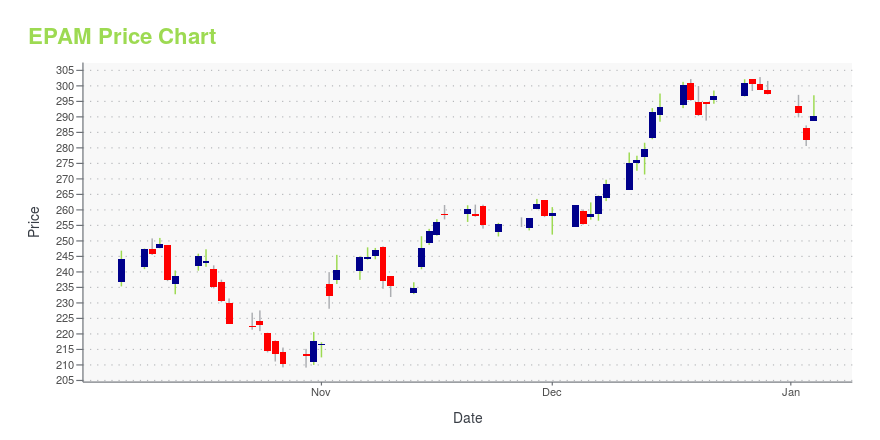
EPAM Stock Price Chart Interactive Chart >
EPAM POWR Grades
- EPAM scores best on the Quality dimension, with a Quality rank ahead of 92.56% of US stocks.
- EPAM's strongest trending metric is Growth; it's been moving down over the last 177 days.
- EPAM ranks lowest in Growth; there it ranks in the 9th percentile.
EPAM Stock Summary
- EPAM has a higher market value than 87.18% of US stocks; more precisely, its current market capitalization is $13,580,384,031.
- The price/operating cash flow metric for EPAM SYSTEMS INC is higher than 83.82% of stocks in our set with a positive cash flow.
- Equity multiplier, or assets relative to shareholders' equity, comes in at 1.29 for EPAM SYSTEMS INC; that's greater than it is for just 16.81% of US stocks.
- If you're looking for stocks that are quantitatively similar to EPAM SYSTEMS INC, a group of peers worth examining would be EXLS, MEDP, WTTR, FDS, and DCO.
- Visit EPAM's SEC page to see the company's official filings. To visit the company's web site, go to www.epam.com.
EPAM Valuation Summary
- In comparison to the median Technology stock, EPAM's price/sales ratio is 20.83% higher, now standing at 2.9.
- Over the past 143 months, EPAM's EV/EBIT ratio has gone up 3.5.
Below are key valuation metrics over time for EPAM.
Stock | Date | P/S | P/B | P/E | EV/EBIT |
---|---|---|---|---|---|
EPAM | 2023-11-03 | 2.9 | 4.2 | 29.3 | 20.0 |
EPAM | 2023-11-02 | 2.8 | 4.1 | 25.2 | 17.7 |
EPAM | 2023-11-01 | 2.6 | 3.8 | 23.5 | 16.4 |
EPAM | 2023-10-31 | 2.6 | 3.9 | 23.6 | 16.4 |
EPAM | 2023-10-30 | 2.5 | 3.8 | 23.1 | 16.0 |
EPAM | 2023-10-27 | 2.5 | 3.7 | 22.9 | 15.8 |
EPAM Growth Metrics
- Its 2 year net cashflow from operations growth rate is now at 44.67%.
- Its 2 year net income to common stockholders growth rate is now at 61.73%.
- Its year over year net cashflow from operations growth rate is now at 2.77%.

The table below shows EPAM's growth in key financial areas (numbers in millions of US dollars).
Date | Revenue | Operating Cash Flow | Net Income to Common Stock |
---|---|---|---|
2022-12-31 | 4,824.698 | 464.104 | 419.416 |
2022-09-30 | 4,700.859 | 562.649 | 406.656 |
2022-06-30 | 4,462.478 | 516.331 | 366.258 |
2022-03-31 | 4,148.983 | 507.652 | 462.325 |
2021-12-31 | 3,758.144 | 572.327 | 481.652 |
2021-09-30 | 3,374.173 | 447.145 | 424.912 |
EPAM's Quality Factors
The “Quality” component of the POWR Ratings focuses on 31 different factors of a companies fundamentals and operational strength. Here are some key insights as we drill into the specifics of these quality attributes.- EPAM has a Quality Grade of B, ranking ahead of 88.15% of graded US stocks.
- EPAM's asset turnover comes in at 1.103 -- ranking 108th of 561 Business Services stocks.
- ACN, CRTO, and IPG are the stocks whose asset turnover ratios are most correlated with EPAM.
The table below shows EPAM's key quality metrics over time.
Period | Asset Turnover | Gross Margin | ROIC |
---|---|---|---|
2021-06-30 | 1.103 | 0.344 | 0.463 |
2021-03-31 | 1.068 | 0.345 | 0.408 |
2020-12-31 | 1.066 | 0.349 | 0.379 |
2020-09-30 | 1.082 | 0.347 | 0.362 |
2020-06-30 | 1.115 | 0.349 | 0.349 |
2020-03-31 | 1.137 | 0.353 | 0.359 |
EPAM Systems Inc. (EPAM) Company Bio
EPAM Systems, Inc. ("Effective Programming for America") is an American company that specializes in service development, digital platform engineering, and digital product design, operating out of Newtown, Pennsylvania. (Source:Wikipedia)
Latest EPAM News From Around the Web
Below are the latest news stories about EPAM SYSTEMS INC that investors may wish to consider to help them evaluate EPAM as an investment opportunity.
EPAM Systems (NYSE:EPAM) Has More To Do To Multiply In Value Going ForwardIf we want to find a stock that could multiply over the long term, what are the underlying trends we should look for... |
If You Invested $1000 in Epam a Decade Ago, This is How Much It'd Be Worth NowInvesting in certain stocks can pay off in the long run, especially if you hold on for a decade or more. |
EPAM Continuum Study Reveals Key Insights for Combatting the Tech Talent ShortageThe tech industry is highly competitive, and organizations that struggle to attract and retain skilled technologists may find it challenging to fill critical positions with qualified candidates. This can lead to project delivery delays and reduced productivity—interfering with an organization's ability to innovate and stay competitive. |
EPAM Systems, Inc.'s (NYSE:EPAM) Stock Is Going Strong: Is the Market Following Fundamentals?Most readers would already be aware that EPAM Systems' (NYSE:EPAM) stock increased significantly by 14% over the past... |
EPAM Systems, Inc. (NYSE:EPAM) Q3 2023 Earnings Call TranscriptEPAM Systems, Inc. (NYSE:EPAM) Q3 2023 Earnings Call Transcript November 2, 2023 EPAM Systems, Inc. beats earnings expectations. Reported EPS is $2.73, expectations were $2.55. Operator: Hello, and thank you for standing by. My name is Regina and I will be your conference operator today. At this time, I would like to welcome everyone to […] |
EPAM Price Returns
1-mo | 7.29% |
3-mo | -0.64% |
6-mo | 22.91% |
1-year | -30.17% |
3-year | -20.52% |
5-year | N/A |
YTD | -21.20% |
2022 | -50.97% |
2021 | 86.54% |
2020 | 68.91% |
2019 | 82.88% |
2018 | 7.99% |
Continue Researching EPAM
Here are a few links from around the web to help you further your research on EPAM Systems Inc's stock as an investment opportunity:EPAM Systems Inc (EPAM) Stock Price | Nasdaq
EPAM Systems Inc (EPAM) Stock Quote, History and News - Yahoo Finance
EPAM Systems Inc (EPAM) Stock Price and Basic Information | MarketWatch
Loading social stream, please wait...