Evolution Petroleum Corporation, Inc. (EPM): Price and Financial Metrics

Evolution Petroleum Corporation, Inc. (EPM): $6.70

0.03 (-0.45%)

POWR Rating

Component Grades

Momentum

C

Stability

D

Sentiment

Quality

B

Add EPM to Watchlist
Sign Up

Industry: Energy - Oil & Gas

Industry

D

Ranked

#61 of 89

in industry

EPM Price/Volume Stats

Current price $6.70 52-week high $10.11
Prev. close $6.73 52-week low $5.39
Day low $6.62 Volume 455,938
Day high $6.82 Avg. volume 396,427
50-day MA $8.65 Dividend yield 7.35%
200-day MA $7.40 Market Cap 222.68M

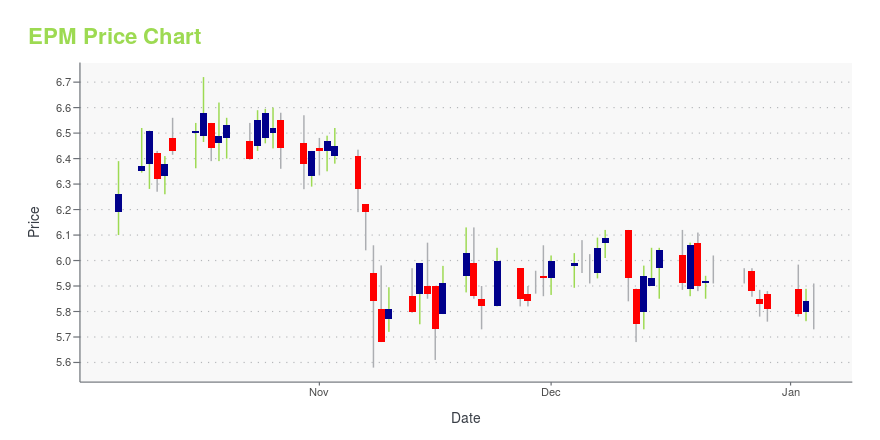
EPM Stock Price Chart Interactive Chart >

EPM POWR Grades

  • Quality is the dimension where EPM ranks best; there it ranks ahead of 78.6% of US stocks.
  • EPM's strongest trending metric is Stability; it's been moving down over the last 177 days.
  • EPM ranks lowest in Growth; there it ranks in the 1st percentile.

EPM Stock Summary

  • The ratio of debt to operating expenses for EVOLUTION PETROLEUM CORP is higher than it is for about just 4.42% of US stocks.
  • With a year-over-year growth in debt of -99.41%, EVOLUTION PETROLEUM CORP's debt growth rate surpasses just 0.81% of about US stocks.
  • Shareholder yield, a measure of how much is returned to shareholders via dividends and share repurchases, for EPM comes in at 19.31% -- higher than that of 90.6% of stocks in our set.
  • Stocks with similar financial metrics, market capitalization, and price volatility to EVOLUTION PETROLEUM CORP are MXC, LC, TXRH, RNGR, and AEMD.
  • Visit EPM's SEC page to see the company's official filings. To visit the company's web site, go to www.evolutionpetroleum.com.

EPM Valuation Summary

  • EPM's price/sales ratio is 1.8; this is 28.57% higher than that of the median Energy stock.
  • Over the past 209 months, EPM's EV/EBIT ratio has gone up 55.

Below are key valuation metrics over time for EPM.

Stock Date P/S P/B P/E EV/EBIT
EPM 2023-09-14 1.8 2.5 6.5 4.8
EPM 2023-09-13 1.8 2.5 6.6 4.8
EPM 2023-09-12 1.9 3.1 5.9 4.3
EPM 2023-09-11 2.0 3.1 6.0 4.4
EPM 2023-09-08 1.9 3.1 5.9 4.3
EPM 2023-09-07 1.9 3.0 5.8 4.2

EPM Growth Metrics

    The 2 year price growth rate now stands at 132.47%.
  • Its year over year net cashflow from operations growth rate is now at 1033.65%.
  • Its 3 year cash and equivalents growth rate is now at -54.76%.
Over the past 15 months, EPM's revenue has gone up $95,195,641.

The table below shows EPM's growth in key financial areas (numbers in millions of US dollars).

Date Revenue Operating Cash Flow Net Income to Common Stock
2022-12-31 141.1816 66.33569 41.67143
2022-09-30 129.844 64.23225 38.1166
2022-06-30 108.926 52.46 32.628
2022-03-31 80.60955 30.86449 19.9726
2021-12-31 62.5562 17.40218 15.45779
2021-09-30 45.98599 9.178329 -4.084385

EPM's Quality Factors

The “Quality” component of the POWR Ratings focuses on 31 different factors of a companies fundamentals and operational strength. Here are some key insights as we drill into the specifics of these quality attributes.
  • EPM has a Quality Grade of C, ranking ahead of 47.39% of graded US stocks.
  • EPM's asset turnover comes in at 0.454 -- ranking 53rd of 136 Petroleum and Natural Gas stocks.
  • DMLP, AXAS, and CLR are the stocks whose asset turnover ratios are most correlated with EPM.

The table below shows EPM's key quality metrics over time.

Period Asset Turnover Gross Margin ROIC
2021-06-30 0.454 0.493 -0.400
2021-03-31 0.294 0.495 -0.510
2020-12-31 0.269 0.484 -0.453
2020-09-30 0.287 0.508 -0.133
2020-06-30 0.315 0.544 0.057
2020-03-31 0.386 0.596 0.163

Evolution Petroleum Corporation, Inc. (EPM) Company Bio


Evolution Petroleum Corporation engages primarily in the acquisition, exploitation, and development of properties for the production of crude oil and natural gas, onshore in the United States. The company was founded in 2003 and is based in Houston, Texas.


EPM Latest News Stream


Event/Time News Detail
Loading, please wait...

EPM Latest Social Stream


Loading social stream, please wait...

View Full EPM Social Stream

Latest EPM News From Around the Web

Below are the latest news stories about EVOLUTION PETROLEUM CORP that investors may wish to consider to help them evaluate EPM as an investment opportunity.

Evolution Petroleum (EPM) Dips More Than Broader Markets: What You Should Know

Evolution Petroleum (EPM) closed the most recent trading day at $6.47, moving -0.92% from the previous trading session.

Yahoo | September 22, 2023

7 Penny Stocks That Should Be on Every Investor’s Radar This Fall

Unlock the massive upside potential of the market by exploring our curated list of the best penny stocks to watch today!

Josh Enomoto on InvestorPlace | September 21, 2023

Are Options Traders Betting on a Big Move in Evolution Petroleum (EPM) Stock?

Investors need to pay close attention to Evolution Petroleum (EPM) stock based on the movements in the options market lately.

Yahoo | September 18, 2023

Evolution Petroleum to Participate in Northland Investor Conference and Posts Updated Presentation

HOUSTON, Sept. 18, 2023 (GLOBE NEWSWIRE) -- Evolution Petroleum Corporation (NYSE American: EPM) ("Evolution" or the "Company") announced today that Kelly Loyd, President and Chief Executive Officer, Ryan Stash, Chief Financial Officer, and Mark Bunch, Chief Operating Officer, will participate in the virtual Northland Capital Markets Institutional Investor Conference on September 19, 2023. An updated investor presentation to be used for the conference is available on the "Investors" section of E

Yahoo | September 18, 2023

Evolution Petroleum Corporation (AMEX:EPM) Q4 2023 Earnings Call Transcript

Evolution Petroleum Corporation (AMEX:EPM) Q4 2023 Earnings Call Transcript September 13, 2023 Operator: Good afternoon and welcome to the Evolution Petroleum Fiscal Fourth Quarter 2023 Earnings Release Conference Call. At this time, all participants have been placed in a listen-only mode and floor will be open for questions and comments after the presentation. I will […]

Yahoo | September 17, 2023

Read More 'EPM' Stories Here

EPM Price Returns

1-mo -22.09%
3-mo -15.63%
6-mo 10.47%
1-year 11.99%
3-year 250.88%
5-year -17.43%
YTD -6.56%
2022 58.73%
2021 86.00%
2020 -44.78%
2019 -14.47%
2018 4.19%

EPM Dividends

Ex-Dividend Date Type Payout Amount Change
Loading, please wait...
View Full EPM Dividend History

Continue Researching EPM

Here are a few links from around the web to help you further your research on Evolution Petroleum Corp's stock as an investment opportunity:

Evolution Petroleum Corp (EPM) Stock Price | Nasdaq
Evolution Petroleum Corp (EPM) Stock Quote, History and News - Yahoo Finance
Evolution Petroleum Corp (EPM) Stock Price and Basic Information | MarketWatch

Get Free Updates

Join thousands of investors who get the latest news, insights and top rated picks from StockNews.com!