EPR Properties (EPR): Price and Financial Metrics
EPR Price/Volume Stats
Current price | $42.18 | 52-week high | $49.10 |
Prev. close | $41.46 | 52-week low | $35.28 |
Day low | $41.50 | Volume | 494,300 |
Day high | $42.23 | Avg. volume | 643,222 |
50-day MA | $42.80 | Dividend yield | 7.97% |
200-day MA | $44.18 | Market Cap | 3.19B |
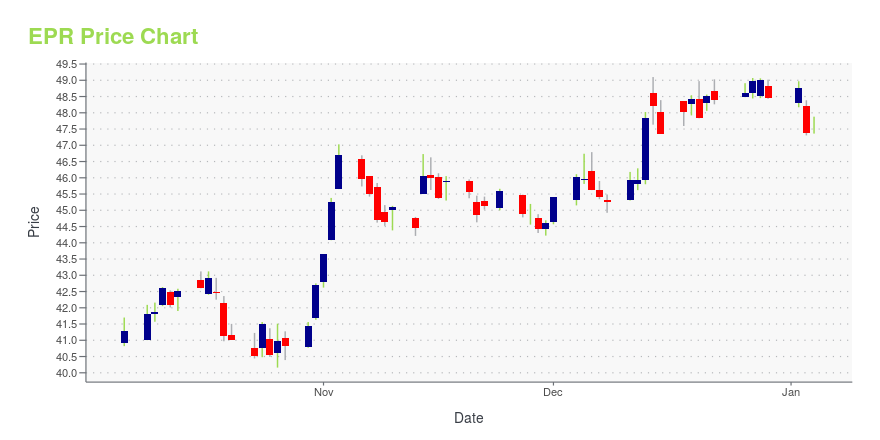
EPR Stock Price Chart Interactive Chart >
EPR POWR Grades
- Growth is the dimension where EPR ranks best; there it ranks ahead of 84.59% of US stocks.
- The strongest trend for EPR is in Stability, which has been heading down over the past 26 weeks.
- EPR ranks lowest in Sentiment; there it ranks in the 17th percentile.
EPR Stock Summary
- Of note is the ratio of EPR PROPERTIES's sales and general administrative expense to its total operating expenses; only 5.29% of US stocks have a lower such ratio.
- For EPR, its debt to operating expenses ratio is greater than that reported by 90% of US equities we're observing.
- The volatility of EPR PROPERTIES's share price is greater than that of merely 8.17% US stocks with at least 200 days of trading history.
- Stocks that are quantitatively similar to EPR, based on their financial statements, market capitalization, and price volatility, are STAG, OHI, HST, SITC, and HIW.
- EPR's SEC filings can be seen here. And to visit EPR PROPERTIES's official web site, go to www.eprkc.com.
EPR Valuation Summary
- In comparison to the median Real Estate stock, EPR's price/earnings ratio is 18.96% lower, now standing at 25.
- Over the past 243 months, EPR's price/earnings ratio has gone up 1.9.
Below are key valuation metrics over time for EPR.
Stock | Date | P/S | P/B | P/E | EV/EBIT |
---|---|---|---|---|---|
EPR | 2023-12-29 | 5.1 | 1.5 | 25.0 | 21.9 |
EPR | 2023-12-28 | 5.2 | 1.5 | 25.3 | 22.1 |
EPR | 2023-12-27 | 5.2 | 1.5 | 25.3 | 22.1 |
EPR | 2023-12-26 | 5.1 | 1.5 | 25.1 | 22.0 |
EPR | 2023-12-22 | 5.1 | 1.5 | 25.0 | 21.9 |
EPR | 2023-12-21 | 5.1 | 1.5 | 25.1 | 21.9 |
EPR Growth Metrics
- The 5 year cash and equivalents growth rate now stands at 2761.84%.
- Its 2 year price growth rate is now at 98.5%.
- Its 4 year revenue growth rate is now at 26.78%.
The table below shows EPR's growth in key financial areas (numbers in millions of US dollars).
Date | Revenue | Operating Cash Flow | Net Income to Common Stock |
---|---|---|---|
2022-12-31 | 658.031 | 441.716 | 152.088 |
2022-09-30 | 634.234 | 420.176 | 154.324 |
2022-06-30 | 612.471 | 383.175 | 135.642 |
2022-03-31 | 577.387 | 356.706 | 113.285 |
2021-12-31 | 531.68 | 306.925 | 74.472 |
2021-09-30 | 470.186 | 242.219 | 9.938 |
EPR's Quality Factors
The “Quality” component of the POWR Ratings focuses on 31 different factors of a companies fundamentals and operational strength. Here are some key insights as we drill into the specifics of these quality attributes.- EPR has a Quality Grade of D, ranking ahead of 21.04% of graded US stocks.
- EPR's asset turnover comes in at 0.061 -- ranking 292nd of 444 Trading stocks.
- RPT, RLJ, and AMP are the stocks whose asset turnover ratios are most correlated with EPR.
The table below shows EPR's key quality metrics over time.
Period | Asset Turnover | Gross Margin | ROIC |
---|---|---|---|
2021-06-30 | 0.061 | 0.847 | 0.010 |
2021-03-31 | 0.056 | 0.838 | 0.002 |
2020-12-31 | 0.060 | 0.859 | 0.004 |
2020-09-30 | 0.065 | 0.871 | 0.009 |
2020-06-30 | 0.083 | 0.897 | 0.019 |
2020-03-31 | 0.094 | 0.909 | 0.032 |
EPR Price Target
For more insight on analysts targets of EPR, see our EPR price target page. And for a list of of all stocks sorted by upside potential based on analyst target price, see our Top Price Target page.
Average Price Target | $55.57 | Average Broker Recommendation | 1.86 (Hold) |
EPR Properties (EPR) Company Bio
EPR Properties develops, owns, leases and finances properties in select market segments primarily related to entertainment, education and recreation. The company was founded in 1997 and is based in Kansas City, Missouri.
Latest EPR News From Around the Web
Below are the latest news stories about EPR PROPERTIES that investors may wish to consider to help them evaluate EPR as an investment opportunity.
Is EPR Properties Stock a Buy?The experiential REIT still has a big problem to deal with, but it has a high yield and strong dividend coverage. |
7 Growth Stocks That Also Pay Monthly Dividends: December 2023While it’s obvious there are great reasons to buy and hold stocks, it’s also easy to overlook a regular income gained by owning monthly dividend-paying growth stocks. |
Where Will EPR Properties Be in 5 Years?EPR Properties is looking to make a strategic shift in its portfolio, but it will probably take some time to get it done. |
JP Morgan Upgrades Six REITs To Start The WeekWith real estate investment trusts (REITs) showing strength following the Federal Reserve's recent announcement of three possible rate cuts in 2024, analysts are scurrying to update their ratings on REITs. A positive start to the week was solidified by two analysts at JP Morgan upgrading six REITs from a cross-section of REIT subsectors. All six REITs were upgraded from Neutral to Overweight. Take a look at the six REITs receiving upgrades this week. EPR Properties (NYSE:EPR) is a Kansas City, M |
Generate Passive Income with These 7 Monthly Dividend REITsOne of the best ways to protect your portfolio, and generate consistent income is buying REITs with monthly dividends. |
EPR Price Returns
1-mo | 3.02% |
3-mo | -11.22% |
6-mo | 5.49% |
1-year | 23.40% |
3-year | 11.04% |
5-year | -27.06% |
YTD | -11.22% |
2023 | 38.83% |
2022 | -14.61% |
2021 | 50.60% |
2020 | -52.09% |
2019 | 17.13% |
EPR Dividends
Ex-Dividend Date | Type | Payout Amount | Change | ||||||
---|---|---|---|---|---|---|---|---|---|
Loading, please wait... |
Continue Researching EPR
Want to do more research on Epr Properties's stock and its price? Try the links below:Epr Properties (EPR) Stock Price | Nasdaq
Epr Properties (EPR) Stock Quote, History and News - Yahoo Finance
Epr Properties (EPR) Stock Price and Basic Information | MarketWatch
Loading social stream, please wait...