EPR Properties (EPR): Price and Financial Metrics
GET POWR RATINGS... FREE!
EPR POWR Grades
- Growth is the dimension where EPR ranks best; there it ranks ahead of 94.95% of US stocks.
- The strongest trend for EPR is in Quality, which has been heading up over the past 179 days.
- EPR's current lowest rank is in the Stability metric (where it is better than 33.11% of US stocks).
EPR Stock Summary
- For EPR, its debt to operating expenses ratio is greater than that reported by 94.33% of US equities we're observing.
- In terms of twelve month growth in earnings before interest and taxes, Epr Properties is reporting a growth rate of 481.45%; that's higher than 95.56% of US stocks.
- Shareholder yield, a measure of how much is returned to shareholders via dividends and share repurchases, for EPR comes in at 24.02% -- higher than that of 92.79% of stocks in our set.
- Stocks with similar financial metrics, market capitalization, and price volatility to Epr Properties are SBGI, FCPT, AER, AMC, and MAC.
- Visit EPR's SEC page to see the company's official filings. To visit the company's web site, go to www.eprkc.com.
EPR Valuation Summary
- In comparison to the median Real Estate stock, EPR's price/sales ratio is 470.59% higher, now standing at 9.7.
- EPR's EV/EBIT ratio has moved up 55.8 over the prior 243 months.
Below are key valuation metrics over time for EPR.
Stock | Date | P/S | P/B | P/E | EV/EBIT |
---|---|---|---|---|---|
EPR | 2021-09-02 | 9.7 | 1.4 | -35.3 | 67.6 |
EPR | 2021-09-01 | 9.7 | 1.4 | -35.3 | 67.5 |
EPR | 2021-08-31 | 9.6 | 1.4 | -35.1 | 67.3 |
EPR | 2021-08-30 | 9.6 | 1.4 | -35.0 | 67.2 |
EPR | 2021-08-27 | 9.6 | 1.4 | -35.2 | 67.4 |
EPR | 2021-08-26 | 9.5 | 1.4 | -34.6 | 66.7 |
EPR Growth Metrics
- The 3 year net income to common stockholders growth rate now stands at 53.04%.
- Its year over year net income to common stockholders growth rate is now at -226.51%.
- The year over year cash and equivalents growth rate now stands at -55.76%.

The table below shows EPR's growth in key financial areas (numbers in millions of US dollars).
Date | Revenue | Operating Cash Flow | Net Income to Common Stock |
---|---|---|---|
2021-12-31 | 531.68 | 306.925 | 74.472 |
2021-09-30 | 470.186 | 242.219 | 9.938 |
2021-06-30 | 394.416 | 148.66 | -108.084 |
2021-03-31 | 375.414 | 54.535 | -189.602 |
2020-12-31 | 414.661 | 65.273 | -155.864 |
2020-09-30 | 448.116 | 161.746 | -99.59 |
EPR's Quality Factors
The “Quality” component of the POWR Ratings focuses on 31 different factors of a companies fundamentals and operational strength. Here are some key insights as we drill into the specifics of these quality attributes.- EPR has a Quality Grade of D, ranking ahead of 21.04% of graded US stocks.
- EPR's asset turnover comes in at 0.061 -- ranking 292nd of 444 Trading stocks.
- RPT, RLJ, and AMP are the stocks whose asset turnover ratios are most correlated with EPR.
The table below shows EPR's key quality metrics over time.
Period | Asset Turnover | Gross Margin | ROIC |
---|---|---|---|
2021-06-30 | 0.061 | 0.847 | 0.010 |
2021-03-31 | 0.056 | 0.838 | 0.002 |
2020-12-31 | 0.060 | 0.859 | 0.004 |
2020-09-30 | 0.065 | 0.871 | 0.009 |
2020-06-30 | 0.083 | 0.897 | 0.019 |
2020-03-31 | 0.094 | 0.909 | 0.032 |
EPR Price Target
For more insight on analysts targets of EPR, see our EPR price target page. And for a list of of all stocks sorted by upside potential based on analyst target price, see our Top Price Target page.
Average Price Target | $55.57 | Average Broker Recommendation | 1.86 (Hold) |
EPR Stock Price Chart Interactive Chart >
EPR Price/Volume Stats
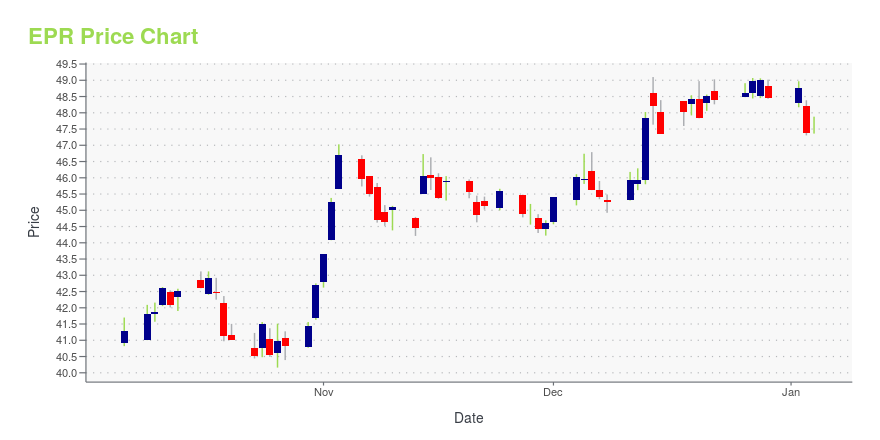
Current price | $50.50 | 52-week high | $56.38 |
Prev. close | $50.82 | 52-week low | $41.14 |
Day low | $49.39 | Volume | 546,800 |
Day high | $51.45 | Avg. volume | 609,569 |
50-day MA | $52.70 | Dividend yield | 6.53% |
200-day MA | $49.83 | Market Cap | 3.79B |
EPR Properties (EPR) Company Bio
EPR Properties develops, owns, leases and finances properties in select market segments primarily related to entertainment, education and recreation. The company was founded in 1997 and is based in Kansas City, Missouri.
Latest EPR News From Around the Web
Below are the latest news stories about Epr Properties that investors may wish to consider to help them evaluate EPR as an investment opportunity.
Redwood Hedge Fund Gains 14% in 2021 on Malls, AMC’s Landlord(Bloomberg) -- Redwood Capital Management posted a 14% net return in its $4.2 billion flagship hedge fund last year, according to people with knowledge of the matter.Most Read from BloombergRussia Invasion of Ukraine Ignites European Security CrisisBiden Cites Turmoil for Russia’s Ruble, Markets: Ukraine UpdateRussia Hits Airfields; Kyiv Imposes Martial Law: Ukraine UpdateStocks Rise as Oil Pares Gain After Biden Address: Markets WrapSix Early Thoughts on Russia's Invasion of UkraineThe New York |
This Dividend Stock Yields Almost 7% and Could Double Your Money in 5 YearsEPR Properties (NYSE: EPR) is a real estate investment trust, or REIT, that focuses on experiential properties. Among the types of properties you'll find in EPR's portfolio are movie theaters, ski resorts, golf attractions, family entertainment centers, and indoor waterparks, just to name a few. The company has grown impressively over the years, and investors have been rewarded with market-beating returns as a result. |
EPR Properties Consensus Indicates Potential 17.0% UpsideEPR Properties with ticker code (EPR) now have 8 analysts covering the stock. The analyst consensus points to a rating of ''Hold''. The range between the high target price and low target price is between 62 and 51 and has a mean target at 54.94. With the stocks previous close at 46.96 this now indicates there is a potential upside of 17.0%. There is a 50 day moving average of 45.96 and the 200 moving average now moves to 49.57. The company has a market cap of $3,419m. Company Website: https://www.eprkc.com [stock_market_widget type="chart" template="basic" color="green" assets=EPR" range="6mo" interval="1d" axes="true" cursor="true" api="yf"] The potential market cap would be $4,000m based on the market concensus. EPR Properties is a leading experiential net lease real estate investment... |
EPR Properties (EPR) CEO Greg Silvers on Q4 2021 Results - Earnings Call TranscriptNo summary available. |
EPR Properties (EPR) Q4 2021 Earnings Call TranscriptEPR earnings call for the period ending December 31, 2021. |
EPR Price Returns
1-mo | -9.18% |
3-mo | N/A |
6-mo | 3.71% |
1-year | 12.01% |
3-year | -26.92% |
5-year | -7.64% |
YTD | 8.60% |
2021 | 50.60% |
2020 | -52.09% |
2019 | 17.13% |
2018 | 4.78% |
2017 | -3.41% |
EPR Dividends
Ex-Dividend Date | Type | Payout Amount | Change | ||||||
---|---|---|---|---|---|---|---|---|---|
Loading, please wait... |
Continue Researching EPR
Want to do more research on Epr Properties's stock and its price? Try the links below:Epr Properties (EPR) Stock Price | Nasdaq
Epr Properties (EPR) Stock Quote, History and News - Yahoo Finance
Epr Properties (EPR) Stock Price and Basic Information | MarketWatch
Loading social stream, please wait...