
Equillium, Inc. (EQ): Price and Financial Metrics
EQ Price/Volume Stats
| Current price | $0.47 | 52-week high | $1.89 |
| Prev. close | $0.44 | 52-week low | $0.36 |
| Day low | $0.44 | Volume | 74,700 |
| Day high | $0.49 | Avg. volume | 700,642 |
| 50-day MA | $0.70 | Dividend yield | N/A |
| 200-day MA | $0.78 | Market Cap | 16.88M |
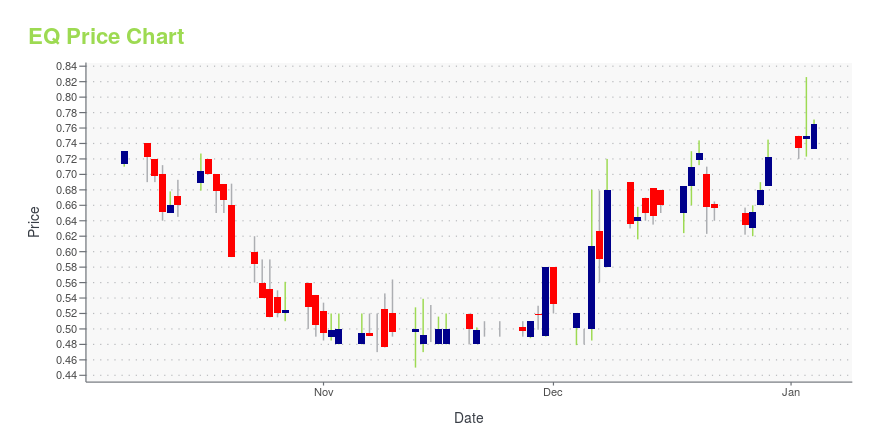
EQ Stock Price Chart Interactive Chart >
Equillium, Inc. (EQ) Company Bio
Equillium Inc. is leveraging deep understanding of immunobiology to develop products for severe autoimmune and inflammatory, or immuno-inflammatory, disorders with high unmet medical need. The company is based in La Jolla, California.
EQ Price Returns
| 1-mo | -41.96% |
| 3-mo | -27.01% |
| 6-mo | -58.41% |
| 1-year | -72.83% |
| 3-year | -84.23% |
| 5-year | -82.81% |
| YTD | -37.18% |
| 2024 | 3.49% |
| 2023 | -31.79% |
| 2022 | -71.88% |
| 2021 | -29.53% |
| 2020 | 58.28% |
Loading social stream, please wait...