
Equity Bancshares, Inc. - (EQBK): Price and Financial Metrics
EQBK Price/Volume Stats
| Current price | $41.61 | 52-week high | $41.95 |
| Prev. close | $41.08 | 52-week low | $22.78 |
| Day low | $40.92 | Volume | 53,200 |
| Day high | $41.80 | Avg. volume | 51,203 |
| 50-day MA | $35.24 | Dividend yield | 1.16% |
| 200-day MA | $32.01 | Market Cap | 634.68M |
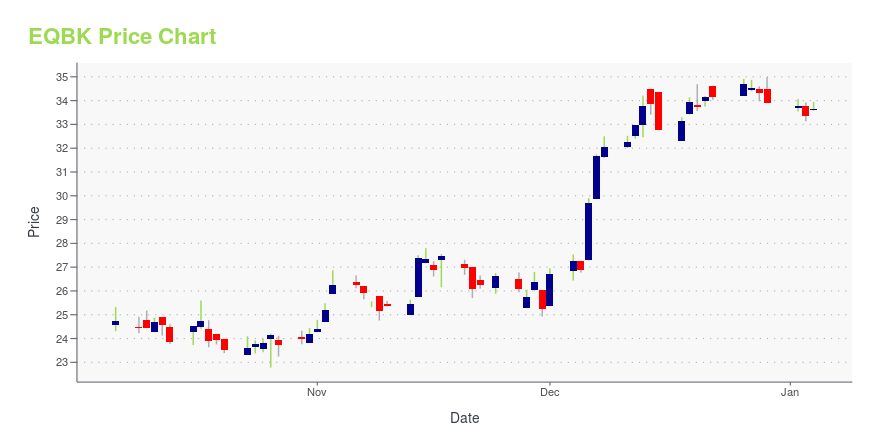
EQBK Stock Price Chart Interactive Chart >
Equity Bancshares, Inc. - (EQBK) Company Bio
Equity Bancshares, Inc. provides a range of financial services primarily to businesses, business owners, and individuals in Kansas and Missouri. The company was founded in 2002 and is based in Wichita, Kansas.
Latest EQBK News From Around the Web
Below are the latest news stories about EQUITY BANCSHARES INC that investors may wish to consider to help them evaluate EQBK as an investment opportunity.
Equity Bancshares, Inc. (NASDAQ:EQBK) Q3 2023 Earnings Call TranscriptEquity Bancshares, Inc. (NASDAQ:EQBK) Q3 2023 Earnings Call Transcript October 18, 2023 Operator: Good day, and thank you for standing by. Welcome to the Q3 2023 Equity Bancshares, Inc. Earnings Conference Call. At this time, all participants are in a listen-only mode. After the speakers’ presentation, there will be a question-and-answer session. [Operator Instructions] Please […] |
Equity Bancshares, Inc. Reports Third Quarter Results; Including Net Interest Margin Growth Driven by Core Deposit BaseStrong Tangible and Regulatory Capital Ratios and Positive Credit Quality Trends ContinueWICHITA, Kan., Oct. 17, 2023 (GLOBE NEWSWIRE) -- Equity Bancshares, Inc. (NYSE: EQBK), (“Equity”, “the Company”, “we,” “us,” “our”), the Wichita-based holding company of Equity Bank, reported net income of $12.3 million and $0.80 earnings per diluted share for the quarter ended September 30, 2023. “Our Company's success is in large part due to our ability to adapt on behalf of our customers and teams no matt |
Equity Bancshares, Inc. Will Announce Third Quarter 2023 Results on October 17, 2023WICHITA, Kansas, Sept. 28, 2023 (GLOBE NEWSWIRE) -- Equity Bancshares, Inc. (NYSE:EQBK), (“Equity”), the Wichita-based holding company of Equity Bank, will release its third quarter results on Tuesday, October 17, 2023, with a press release issued after market close. Equity Chairman and Chief Executive Officer Brad Elliott and Chief Financial Officer Chris Navratil will hold a conference call and webcast to discuss earnings results on Wednesday, October 18, 2023 at 10 a.m. eastern time or 9 a.m. |
Is Equity Bancshares (EQBK) Stock Undervalued Right Now?Here at Zacks, our focus is on the proven Zacks Rank system, which emphasizes earnings estimates and estimate revisions to find great stocks. Nevertheless, we are always paying attention to the latest value, growth, and momentum trends to underscore strong picks. |
Should Value Investors Buy Equity Bancshares (EQBK) Stock?Here at Zacks, our focus is on the proven Zacks Rank system, which emphasizes earnings estimates and estimate revisions to find great stocks. Nevertheless, we are always paying attention to the latest value, growth, and momentum trends to underscore strong picks. |
EQBK Price Returns
| 1-mo | 24.35% |
| 3-mo | 25.36% |
| 6-mo | 24.51% |
| 1-year | 55.33% |
| 3-year | 43.16% |
| 5-year | 61.16% |
| YTD | 23.63% |
| 2023 | 5.53% |
| 2022 | -2.59% |
| 2021 | 57.89% |
| 2020 | -30.06% |
| 2019 | -12.43% |
EQBK Dividends
| Ex-Dividend Date | Type | Payout Amount | Change | ||||||
|---|---|---|---|---|---|---|---|---|---|
| Loading, please wait... | |||||||||
Continue Researching EQBK
Want to see what other sources are saying about Equity Bancshares Inc's financials and stock price? Try the links below:Equity Bancshares Inc (EQBK) Stock Price | Nasdaq
Equity Bancshares Inc (EQBK) Stock Quote, History and News - Yahoo Finance
Equity Bancshares Inc (EQBK) Stock Price and Basic Information | MarketWatch
Loading social stream, please wait...