
Equinix Inc. (EQIX): Price and Financial Metrics
EQIX Price/Volume Stats
| Current price | $772.43 | 52-week high | $914.93 |
| Prev. close | $769.31 | 52-week low | $677.80 |
| Day low | $766.87 | Volume | 541,016 |
| Day high | $779.98 | Avg. volume | 568,257 |
| 50-day MA | $772.89 | Dividend yield | 2.12% |
| 200-day MA | $790.26 | Market Cap | 73.31B |
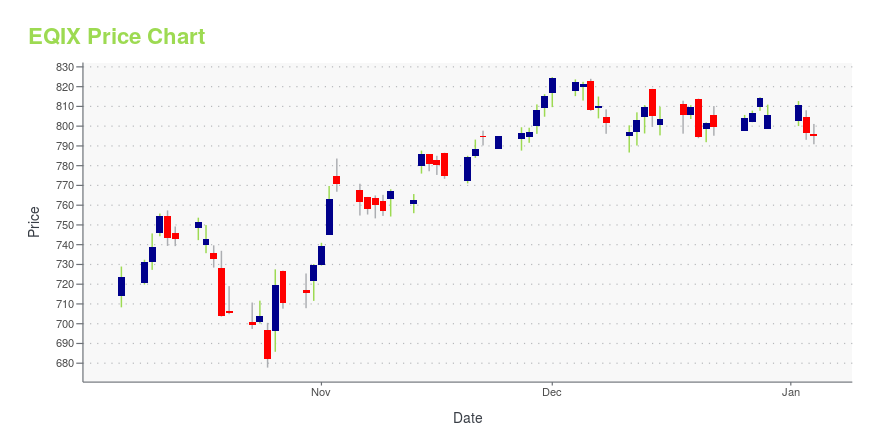
EQIX Stock Price Chart Interactive Chart >
Equinix Inc. (EQIX) Company Bio
Equinix, Inc. is an American multinational company headquartered in Redwood City, California, that specializes in Internet connection and data centers. The company is a leader in global colocation data center market share, with 229 data centers in 27 countries on five continents. (Source:Wikipedia)
Latest EQIX News From Around the Web
Below are the latest news stories about EQUINIX INC that investors may wish to consider to help them evaluate EQIX as an investment opportunity.
Data Center Dynamos: 3 Stocks Powering the Information AgeThese top data center stocks can reward long-term investors due to artificial intelligence and the information age. |
30 US Cities With the Most Foreclosures in 2023In this article, we will take a look at the 30 US cities with the most foreclosures in 2023. If you want to skip our discussion on the trends in the real estate market, you can go directly to the 5 US Cities With the Most Foreclosures in 2023. Following the expiration of the pandemic-related federal […] |
5 Reasons That Make Equinix (EQIX) Stock a Solid Portfolio PickThe data center industry thrives globally, and Equinix (EQIX) is primed to seize this opportunity with its recurring revenue model and strategic growth. |
2 AI-Powered Dividend Stocks to Buy for Income and UpsideAI could give these companies even more power to grow their dividends. |
Equinix Fully Allocates $4.9 Billion of Green Bond ProceedsEquinix, Inc. (Nasdaq: EQIX), the world's digital infrastructure company®, today announced the full allocation of $4.9 billion in investment-grade green bonds to advance its progress toward its near-term science-based target to become climate neutral by 2030 and improve the operational eco-efficiency of its business. Since 2020, six bond offerings have been issued, and as of the end of June 2023, all bonds have been fully allocated. |
EQIX Price Returns
| 1-mo | 4.12% |
| 3-mo | 6.15% |
| 6-mo | -3.77% |
| 1-year | -0.97% |
| 3-year | -3.02% |
| 5-year | 72.51% |
| YTD | -3.11% |
| 2023 | 25.41% |
| 2022 | -21.13% |
| 2021 | 20.28% |
| 2020 | 24.22% |
| 2019 | 68.86% |
EQIX Dividends
| Ex-Dividend Date | Type | Payout Amount | Change | ||||||
|---|---|---|---|---|---|---|---|---|---|
| Loading, please wait... | |||||||||
Continue Researching EQIX
Here are a few links from around the web to help you further your research on Equinix Inc's stock as an investment opportunity:Equinix Inc (EQIX) Stock Price | Nasdaq
Equinix Inc (EQIX) Stock Quote, History and News - Yahoo Finance
Equinix Inc (EQIX) Stock Price and Basic Information | MarketWatch
Loading social stream, please wait...