
EQONEX Ltd. (EQOS): Price and Financial Metrics
EQOS Price/Volume Stats
| Current price | $0.09 | 52-week high | $4.49 |
| Prev. close | $0.14 | 52-week low | $0.09 |
| Day low | $0.09 | Volume | 20,053,900 |
| Day high | $0.18 | Avg. volume | 574,069 |
| 50-day MA | $0.35 | Dividend yield | N/A |
| 200-day MA | $1.01 | Market Cap | 4.32M |
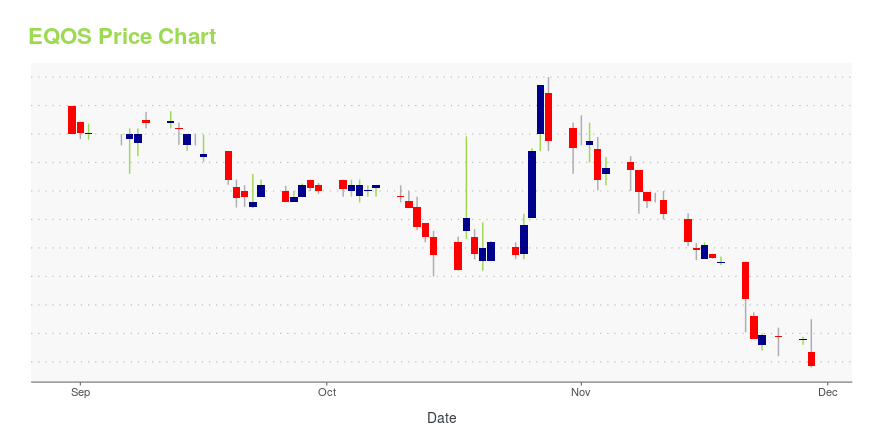
EQOS Stock Price Chart Interactive Chart >
EQONEX Ltd. (EQOS) Company Bio
EQONEX Ltd. is a digital asset financial services and advisory company, provides products, architecture, and infrastructure for the financial markets in the areas of digital asset ecosystem in Singapore and internationally. The firm operates EQONEX, a cryptocurrency exchange that offers the trading of virtual currencies; an over-the-counter trading platform; Digivault, a warm and cold custodian platform for the custody of digital assets for institutional investors; and Access Trading, a digital asset trading tool and front-to-back integrated trading platform, as well as a risk management desk. It also provides asset management services under the Bletchley Park Asset Management name; and EQONEX Capital that assists issuers seeking to access global capital markets through the issuance of either paper securities or digital securities. The company was founded by Miles Christian Pelham in June 2017 and is headquartered in Hong Kong.
Latest EQOS News From Around the Web
Below are the latest news stories about EQONEX LTD that investors may wish to consider to help them evaluate EQOS as an investment opportunity.
Today’s Biggest Pre-Market Stock Movers: 10 Top Gainers and Losers on TuesdayIt's time to start the day with an overview of the biggest pre-market stock movers traders need to know about for Tuesday morning! |
Why Seagate Shares Are Trading Lower By More Than 7%? Here Are 49 Stocks Moving In Wednesday''s Mid-Day SessionGainers ESSA Pharma Inc. (NASDAQ: EPIX ) shares surged 59.3% to $2.7417 after the company highlighted updates results from the Phase 1/2 study of EPI-7386 with Enzalutamide At the 29th Annual Prostate Cancer Foundation Scientific Retreat. Cosmos Holdings Inc. (NASDAQ: COSM ) shares jumped 31.7% to $0.1150. Cosmos Holdings CEO Grigorios Siokas bought a total of 12,500,000 shares at an average price of $0.12. Granite Ridge Resources Inc (NASDAQ: GRNT) gained 25.6% to $12.85. Biophytis S.A. (NASDAQ: BPTS ) rose 24.6% to $0.6723. TransCode Therapeutics, Inc. (NASDAQ: RNAZ ) gained 23.8% to $1.35 after the company reported preclinical results with its lead candidate, TTX-MC138 in Pancreatic Adenocarcinoma. Eqonex Limited (NASDAQ: EQOS ) gained 23.5% to $0.420. Cipher Mining Inc. (NASDAQ: CIF... |
Digital asset custodian Digivault launches ExchangeConnect, a new service to safeguard crypto assets when trading on exchangesFCA-registered crypto custodian Digivault, part of the EQONEX Group (Nasdaq: EQOS) today launched Digivault ExchangeConnect, a new service that enables clients to safely hold their assets within their Digivault FCA-registered custody account whilst trading with them on an exchange. Digivault ExchangeConnect is now available on Bitfinex with more exchanges planned. |
H.C. Wainwright Remains a Hold on EQONEX (EQOS)E ratio of -0.22. |
EQONEX expands its Investment Product offering with multi-currency Exchange-Traded NotesEQONEX Limited (NASDAQ: EQOS) (the Group), a digital assets financial services company, is expanding its Investment Product offering with a USD denominated Bitcoin Exchange-Traded Note (ETN) available on the Deutsche Börse XETRA Exchange from today. |
EQOS Price Returns
| 1-mo | N/A |
| 3-mo | N/A |
| 6-mo | N/A |
| 1-year | N/A |
| 3-year | -98.36% |
| 5-year | N/A |
| YTD | N/A |
| 2023 | N/A |
| 2022 | 0.00% |
| 2021 | -88.41% |
| 2020 | 61.08% |
| 2019 | N/A |
Loading social stream, please wait...