
Erasca, Inc. (ERAS): Price and Financial Metrics
ERAS Price/Volume Stats
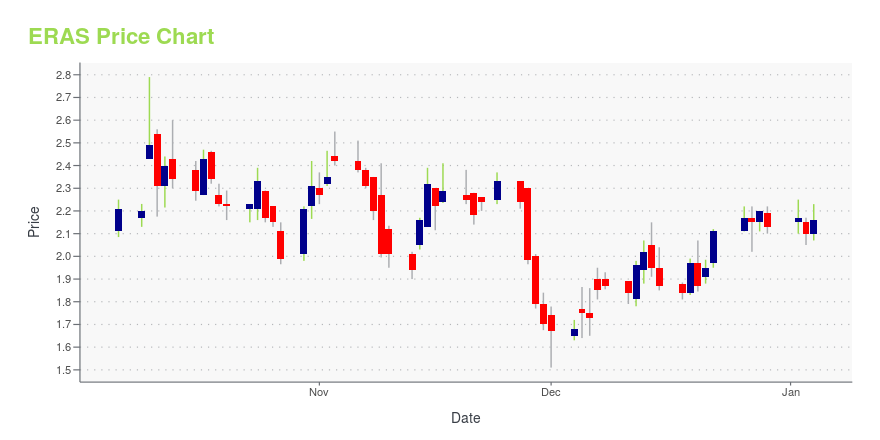
| Current price | $3.28 | 52-week high | $3.45 |
| Prev. close | $3.27 | 52-week low | $1.51 |
| Day low | $3.20 | Volume | 1,377,770 |
| Day high | $3.45 | Avg. volume | 1,491,211 |
| 50-day MA | $2.50 | Dividend yield | N/A |
| 200-day MA | $2.16 | Market Cap | 568.62M |
ERAS Stock Price Chart Interactive Chart >
Erasca, Inc. (ERAS) Company Bio
Erasca, Inc., a clinical-stage biopharmaceutical company, focuses on discovering, developing, and commercializing therapies for patients with RAS/MAPK pathway-driven cancers. Its lead candidates include ERAS-007, an oral inhibitor of ERK1/2 for the treatment of NSCLC, colorectal cancer, and acute myeloid leukemia; and ERAS-601, an oral SHP2 inhibitor for patients with advanced or metastatic solid tumors. The company was incorporated in 2018 and is headquartered in San Diego, California.
Latest ERAS News From Around the Web
Below are the latest news stories about ERASCA INC that investors may wish to consider to help them evaluate ERAS as an investment opportunity.
3 Penny Stocks You’ll Regret Not Buying Soon: December EditionConsider the pros and cons of buying these penny stocks, which can deliver risk-adjusted returns to investors' portfolios. |
Erasca Co-Founder Acquires 3.2% More StockThose following along with Erasca, Inc. ( NASDAQ:ERAS ) will no doubt be intrigued by the recent purchase of shares by... |
Erasca Granted FDA Fast Track Designation for Pan-RAF Inhibitor Naporafenib in Patients with Advanced NRAS-Mutated MelanomaFirst-in-class and best-in-class potential in NRAS-mutated melanoma and other RAS/MAPK pathway-altered solid tumors Naporafenib has been dosed in more than 500 patients to date, establishing its safety, tolerability, and preliminary proof-of-concept in multiple indications Pivotal Phase 3 SEACRAFT-2 trial initiation in NRAS-mutated melanoma on track for H1 2024 SAN DIEGO, Dec. 11, 2023 (GLOBE NEWSWIRE) -- Erasca, Inc. (Nasdaq: ERAS), a clinical-stage precision oncology company singularly focused |
Erasca Achieves Key Milestones for Naporafenib and ERAS-801 Programs and Extends Cash RunwayGained alignment with global health authorities for pivotal Phase 3 SEACRAFT-2 trial design for naporafenib plus trametinib in NRAS mutant melanoma; initiation on track for H1 2024 Completed dose escalation and identified MTD for ERAS-801, supporting enrollment of expansion cohorts in recurrent GBM Extended cash runway to H1 2026 following strategic prioritization of programs SAN DIEGO, Nov. 28, 2023 (GLOBE NEWSWIRE) -- Erasca, Inc. (Nasdaq: ERAS), a clinical-stage precision oncology company sin |
Erasca Reports Third Quarter 2023 Financial Results and Business UpdatesFirst patient dosed in SEACRAFT-1 Phase 1b trial evaluating naporafenib plus trametinib Multiple upcoming catalysts across ongoing clinical programs Strong balance sheet with cash, cash equivalents, and marketable securities of $344 million as of September 30, 2023 SAN DIEGO, Nov. 09, 2023 (GLOBE NEWSWIRE) -- Erasca, Inc. (Nasdaq: ERAS), a clinical-stage precision oncology company singularly focused on discovering, developing, and commercializing therapies for patients with RAS/MAPK pathway-driv |
ERAS Price Returns
| 1-mo | 49.09% |
| 3-mo | 73.54% |
| 6-mo | 94.08% |
| 1-year | 32.26% |
| 3-year | -82.70% |
| 5-year | N/A |
| YTD | 53.99% |
| 2023 | -50.58% |
| 2022 | -72.34% |
| 2021 | N/A |
| 2020 | N/A |
| 2019 | N/A |
Loading social stream, please wait...