
Euroseas Ltd. (ESEA): Price and Financial Metrics
ESEA Price/Volume Stats
| Current price | $37.42 | 52-week high | $42.46 |
| Prev. close | $37.09 | 52-week low | $20.48 |
| Day low | $36.82 | Volume | 9,600 |
| Day high | $37.59 | Avg. volume | 38,706 |
| 50-day MA | $37.83 | Dividend yield | 6.23% |
| 200-day MA | $34.29 | Market Cap | 262.16M |
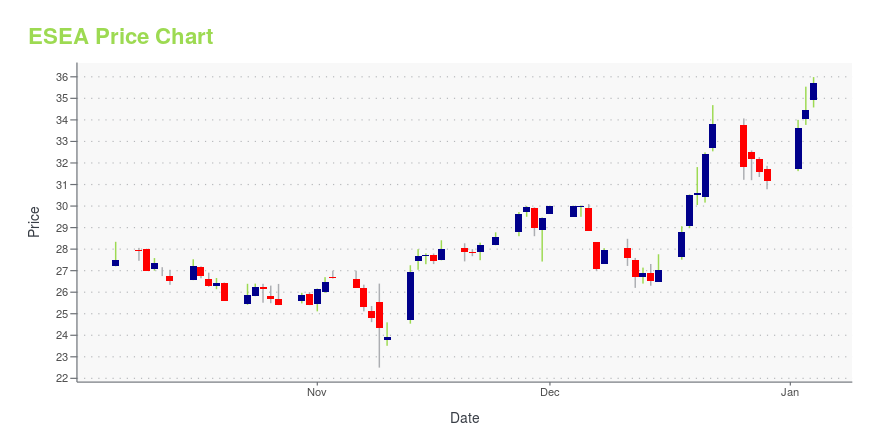
ESEA Stock Price Chart Interactive Chart >
Latest ESEA News From Around the Web
Below are the latest news stories about EUROSEAS LTD that investors may wish to consider to help them evaluate ESEA as an investment opportunity.
11 Best Shipping Stocks That Pay DividendsIn this article, we discuss 11 best shipping stocks that pay dividends. You can skip our detailed analysis of the shipping and transportation industry, and go directly to read 5 Best Shipping Stocks That Pay Dividends. In today’s interconnected global economy, the movement of goods across the world holds immense significance. The World Economic Forum […] |
Euroseas Ltd. Announces Completion of Works on Retrofitting Several Items Aiming to improve the Efficiency on its Feeder Containership, M/V Synergy BusanATHENS, Greece, Dec. 19, 2023 (GLOBE NEWSWIRE) -- Euroseas Ltd. (NASDAQ: ESEA, the “Company” or “Euroseas”), an owner and operator of container carrier vessels and provider of seaborne transportation for containerized cargoes, announced today it has successfully completed the installation of a number of “energy saving devices” on its 4,250 teu feeder containership, M/V Synergy Busan, aiming to improve her consumption in the commercial speed range by about 20%. The investment was done in conjunct |
Live Webinar on the Container Shipping Sector with Senior Executives from Publicly Listed Companies: Thursday, December 7, 2023, at 10 a.m. ETNEW YORK, Dec. 04, 2023 (GLOBE NEWSWIRE) -- Capital Link will host a complimentary webinar on Thursday, December 7, 2023, at 10 a.m. Eastern Time on the Container shipping sector. This is part of the Capital Link Shipping Sector Webinar Series, which provides periodic updates on the main shipping sectors. REGISTRATIONOnline attendance is complimentary. Please click on the link below to register.https://webinars.capitallink.com/2023/shipping2/ FEATURED PANELISTS Mr. Evangelos Chatzis, CFO - Danao |
Read This Before Considering Euroseas Ltd. (NASDAQ:ESEA) For Its Upcoming US$0.50 DividendReaders hoping to buy Euroseas Ltd. ( NASDAQ:ESEA ) for its dividend will need to make their move shortly, as the stock... |
Euroseas (NASDAQ:ESEA) Has Announced A Dividend Of $0.50Euroseas Ltd. ( NASDAQ:ESEA ) will pay a dividend of $0.50 on the 16th of December. Including this payment, the... |
ESEA Price Returns
| 1-mo | 4.79% |
| 3-mo | 12.15% |
| 6-mo | -0.64% |
| 1-year | 94.88% |
| 3-year | 153.13% |
| 5-year | 787.97% |
| YTD | 24.04% |
| 2023 | 83.39% |
| 2022 | -21.02% |
| 2021 | 358.74% |
| 2020 | 33.55% |
| 2019 | -27.39% |
ESEA Dividends
| Ex-Dividend Date | Type | Payout Amount | Change | ||||||
|---|---|---|---|---|---|---|---|---|---|
| Loading, please wait... | |||||||||
Continue Researching ESEA
Want to do more research on Euroseas Ltd's stock and its price? Try the links below:Euroseas Ltd (ESEA) Stock Price | Nasdaq
Euroseas Ltd (ESEA) Stock Quote, History and News - Yahoo Finance
Euroseas Ltd (ESEA) Stock Price and Basic Information | MarketWatch
Loading social stream, please wait...