
Enstar Group Limited - Ordinary Shares (ESGR): Price and Financial Metrics
ESGR Price/Volume Stats
| Current price | $348.31 | 52-week high | $348.48 |
| Prev. close | $335.01 | 52-week low | $229.57 |
| Day low | $338.19 | Volume | 85,900 |
| Day high | $348.48 | Avg. volume | 58,964 |
| 50-day MA | $314.93 | Dividend yield | N/A |
| 200-day MA | $288.08 | Market Cap | 5.30B |
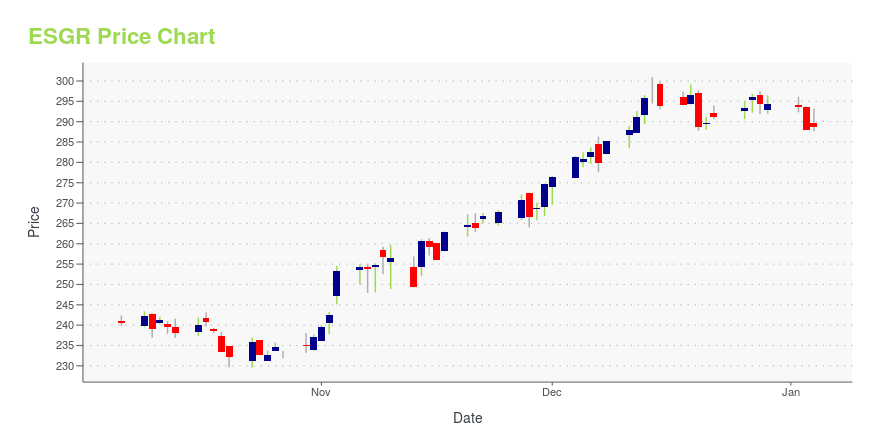
ESGR Stock Price Chart Interactive Chart >
Enstar Group Limited - Ordinary Shares (ESGR) Company Bio
Enstar Group Limited acquires and manages insurance and reinsurance companies in run-off and portfolios of insurance and reinsurance business in run-off. It operates in four segments: Non-Life Run-Off, Atrium, Torus, and Life and Annuities. The company was founded in 2001 and is based in Hamilton, Bermuda.
Latest ESGR News From Around the Web
Below are the latest news stories about ENSTAR GROUP LTD that investors may wish to consider to help them evaluate ESGR as an investment opportunity.
13 Stocks Insiders are Buying NowIn this article, we will take a look at the 13 stocks insiders are buying now. To see more such companies, go directly to 5 Stocks Insiders are Buying Now. With the end of 2023 now in sight, many can say with confidence that the much-dreaded recession everyone was talking about will not realize this […] |
Enstar Group Limited (NASDAQ:ESGR) is a favorite amongst institutional investors who own 73%Key Insights Institutions' substantial holdings in Enstar Group implies that they have significant influence over the... |
Enstar Group Limited (NASDAQ:ESGR) Q3 2023 Earnings Call TranscriptEnstar Group Limited (NASDAQ:ESGR) Q3 2023 Earnings Call Transcript November 7, 2023 Peter Kalaev: Hello everyone, I’m Peter Kalaev, Group Treasurer. Thank you for listening to Enstar’s Third Quarter 2023 Earnings Audio Review with CEO Dominic Silvester and CFO Matt Kirk. Before we begin, I’d like to remind everyone that this presentation contains forward- looking […] |
Enstar Group Limited Reports Third Quarter 2023 ResultsNet Earnings of $38 million and Return on Equity of 0.9%, Primarily Driven by Investment ResultsBook Value per Ordinary Share of $282.37 (Adjusted* $277.01) as of September 30, 2023Closed Previously Announced Transaction with AIG, Subsequent to Quarter-EndPost-Quarter End, Agreed to Repurchase $191 Million of Ordinary Shares at a 5% Discount to the Trailing 10-Day Volume Weighted Average Price of Enstar Ordinary Shares as of November 3, 2023 (Representing a 19.5% Discount to Book Value Per Ordin |
Enstar Group Limited Announces Quarterly Preference Share DividendsHAMILTON, Bermuda, Nov. 03, 2023 (GLOBE NEWSWIRE) -- Enstar Group Limited (“Enstar”) (Nasdaq: ESGR) today announced that it will pay cash dividends on its Series D and Series E preference shares. Dividends on Enstar’s Series D 7.00% Fixed-to-Floating Rate Perpetual Non-Cumulative Preference Shares of $0.43750 per depositary share (each of which represents a 1/1,000th interest in a Series D Preference Share) will be payable on December 1, 2023 to shareholders of record on November 15, 2023. Divid |
ESGR Price Returns
| 1-mo | 13.80% |
| 3-mo | 20.82% |
| 6-mo | 28.06% |
| 1-year | 35.76% |
| 3-year | 34.30% |
| 5-year | 100.12% |
| YTD | 18.33% |
| 2023 | 27.40% |
| 2022 | -6.68% |
| 2021 | 20.84% |
| 2020 | -0.95% |
| 2019 | 23.45% |
Continue Researching ESGR
Here are a few links from around the web to help you further your research on Enstar Group LTD's stock as an investment opportunity:Enstar Group LTD (ESGR) Stock Price | Nasdaq
Enstar Group LTD (ESGR) Stock Quote, History and News - Yahoo Finance
Enstar Group LTD (ESGR) Stock Price and Basic Information | MarketWatch
Loading social stream, please wait...