
Element Solutions Inc. (ESI): Price and Financial Metrics
ESI Price/Volume Stats
| Current price | $26.93 | 52-week high | $28.68 |
| Prev. close | $26.50 | 52-week low | $17.57 |
| Day low | $26.74 | Volume | 1,368,006 |
| Day high | $27.21 | Avg. volume | 1,393,899 |
| 50-day MA | $25.90 | Dividend yield | 1.16% |
| 200-day MA | $23.22 | Market Cap | 6.52B |
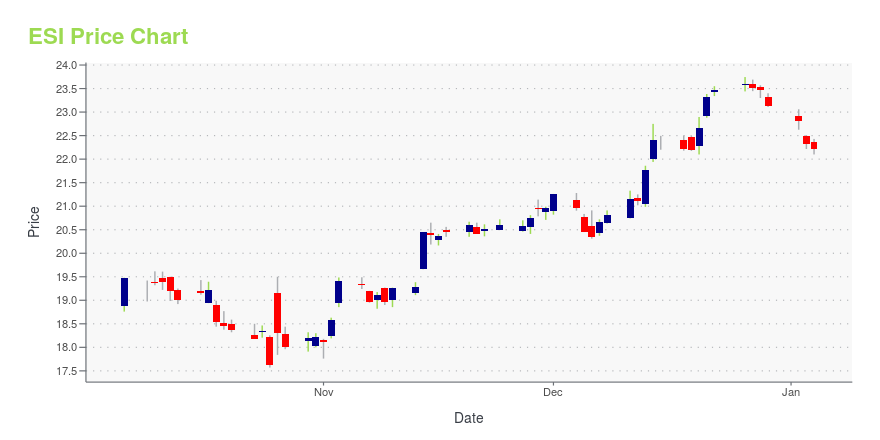
ESI Stock Price Chart Interactive Chart >
Element Solutions Inc. (ESI) Company Bio
Element Solutions Inc. (formerly Platform Specialty Products) is a global, diversified producer of high-technology specialty chemicals and provider of technical services. The business involves the formulation of a broad range of solutions-oriented specialty chemicals, which are sold into multiple industries, including agrochemical, animal health, electronics, graphic arts, plating, and offshore oil production and drilling. The company was founded in 1922 and is based in Miami, Florida.
Latest ESI News From Around the Web
Below are the latest news stories about ELEMENT SOLUTIONS INC that investors may wish to consider to help them evaluate ESI as an investment opportunity.
Element Solutions (ESI) Wraps Up $1.15B Term Loan SyndicationThe new term loan of Element Solution (ESI) has an applicable interest rate of SOFR plus a spread of 2.00% annually. |
Element Solutions Inc Completes Syndication of $1.15 Billion Term Loans and Reduces Debt BalanceMIAMI, December 18, 2023--Element Solutions Inc (NYSE:ESI) ("ESI"), a global and diversified specialty chemicals company, announced that it successfully completed the syndication of a seven-year secured term loan credit facility totaling $1.15 billion under its credit agreement. |
Implied Volatility Surging for Element Solutions (ESI) Stock OptionsInvestors need to pay close attention to Element Solutions (ESI) stock based on the movements in the options market lately. |
Investing in Element Solutions (NYSE:ESI) five years ago would have delivered you a 96% gainGenerally speaking the aim of active stock picking is to find companies that provide returns that are superior to the... |
Element Solutions Inc Receives Sustainability RecognitionsMIAMI, December 07, 2023--Element Solutions Inc (NYSE:ESI), a global and diversified specialty chemicals company, has received two prestigious sustainability awards for the third consecutive year: a ranking on Newsweek's list of America's Most Responsible Companies and an EcoVadis Medal. These accolades underscore Element Solutions Inc's dedication to integrating sustainability into its business operations and its commitment to environmental stewardship, social responsibility, and governance exc |
ESI Price Returns
| 1-mo | -0.37% |
| 3-mo | 13.29% |
| 6-mo | 20.40% |
| 1-year | 32.70% |
| 3-year | 21.17% |
| 5-year | 177.94% |
| YTD | 17.17% |
| 2023 | 29.26% |
| 2022 | -23.91% |
| 2021 | 38.51% |
| 2020 | 52.36% |
| 2019 | 13.07% |
ESI Dividends
| Ex-Dividend Date | Type | Payout Amount | Change | ||||||
|---|---|---|---|---|---|---|---|---|---|
| Loading, please wait... | |||||||||
Continue Researching ESI
Here are a few links from around the web to help you further your research on Element Solutions Inc's stock as an investment opportunity:Element Solutions Inc (ESI) Stock Price | Nasdaq
Element Solutions Inc (ESI) Stock Quote, History and News - Yahoo Finance
Element Solutions Inc (ESI) Stock Price and Basic Information | MarketWatch
Loading social stream, please wait...