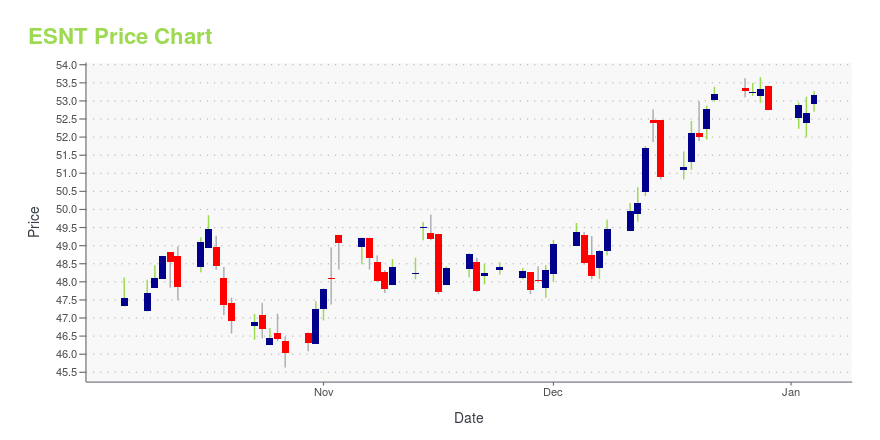
Essent Group Ltd. (ESNT): Price and Financial Metrics
GET POWR RATINGS... FREE!
ESNT POWR Grades
- ESNT scores best on the Stability dimension, with a Stability rank ahead of 82.23% of US stocks.
- ESNT's strongest trending metric is Momentum; it's been moving up over the last 179 days.
- ESNT ranks lowest in Growth; there it ranks in the 11th percentile.
ESNT Stock Summary
- With a price/earnings ratio of 5.48, ESSENT GROUP LTD P/E ratio is greater than that of about just 11.64% of stocks in our set with positive earnings.
- Of note is the ratio of ESSENT GROUP LTD's sales and general administrative expense to its total operating expenses; 86.96% of US stocks have a lower such ratio.
- In terms of volatility of its share price, ESNT is more volatile than only 6.78% of stocks we're observing.
- Stocks with similar financial metrics, market capitalization, and price volatility to ESSENT GROUP LTD are DCO, SND, ASIX, TTEK, and PPSI.
- Visit ESNT's SEC page to see the company's official filings. To visit the company's web site, go to www.essentgroup.com.
ESNT Valuation Summary
- In comparison to the median Financial Services stock, ESNT's price/sales ratio is 48.28% higher, now standing at 4.3.
- ESNT's price/sales ratio has moved down 12 over the prior 112 months.
Below are key valuation metrics over time for ESNT.
Stock | Date | P/S | P/B | P/E | EV/EBIT |
---|---|---|---|---|---|
ESNT | 2023-01-23 | 4.3 | 1 | 5.1 | 4.5 |
ESNT | 2023-01-20 | 4.3 | 1 | 5.1 | 4.5 |
ESNT | 2023-01-19 | 4.2 | 1 | 5.0 | 4.5 |
ESNT | 2023-01-18 | 4.2 | 1 | 5.0 | 4.5 |
ESNT | 2023-01-17 | 4.2 | 1 | 5.0 | 4.5 |
ESNT | 2023-01-13 | 4.2 | 1 | 5.0 | 4.5 |
ESNT Growth Metrics
- The 4 year cash and equivalents growth rate now stands at 57.54%.
- The 4 year net income to common stockholders growth rate now stands at 139.38%.
- Its 3 year net income to common stockholders growth rate is now at 69.48%.

The table below shows ESNT's growth in key financial areas (numbers in millions of US dollars).
Date | Revenue | Operating Cash Flow | Net Income to Common Stock |
---|---|---|---|
2022-09-30 | 1,027.703 | 607.545 | 864.974 |
2022-06-30 | 1,049.472 | 613.359 | 892.276 |
2022-03-31 | 1,048.324 | 702.114 | 820.302 |
2021-12-31 | 1,028.51 | 709.256 | 681.783 |
2021-09-30 | 1,018.793 | 697.592 | 624.398 |
2021-06-30 | 978.295 | 721.941 | 543.581 |
ESNT's Quality Factors
The “Quality” component of the POWR Ratings focuses on 31 different factors of a companies fundamentals and operational strength. Here are some key insights as we drill into the specifics of these quality attributes.- ESNT has a Quality Grade of C, ranking ahead of 65.61% of graded US stocks.
- ESNT's asset turnover comes in at 0.185 -- ranking 87th of 133 Insurance stocks.
- DGICA, AIG, and ITIC are the stocks whose asset turnover ratios are most correlated with ESNT.
The table below shows ESNT's key quality metrics over time.
Period | Asset Turnover | Gross Margin | ROIC |
---|---|---|---|
2021-06-30 | 0.185 | 0.837 | 0.120 |
2021-03-31 | 0.189 | 0.665 | 0.091 |
2020-12-31 | 0.197 | 0.685 | 0.097 |
2020-09-30 | 0.207 | 0.733 | 0.109 |
2020-06-30 | 0.221 | 0.777 | 0.124 |
2020-03-31 | 0.234 | 0.962 | 0.171 |
ESNT Stock Price Chart Interactive Chart >
ESNT Price/Volume Stats
Current price | $43.80 | 52-week high | $47.26 |
Prev. close | $44.03 | 52-week low | $34.27 |
Day low | $43.57 | Volume | 96,436 |
Day high | $44.16 | Avg. volume | 410,901 |
50-day MA | $39.48 | Dividend yield | 2.09% |
200-day MA | $39.69 | Market Cap | 4.72B |
Essent Group Ltd. (ESNT) Company Bio
Essent Group provides private mortgage insurance and reinsurance for mortgages secured by residential properties located in the United States. The company was founded in 2008 and is based in Hamilton, Bermuda.
Latest ESNT News From Around the Web
Below are the latest news stories about ESSENT GROUP LTD that investors may wish to consider to help them evaluate ESNT as an investment opportunity.
Essent Group Ltd. Schedules Fourth Quarter Earnings Conference Call for February 10, 2023Essent Group Ltd. (NYSE: ESNT) today announced that it will hold a conference call on Friday, February 10, 2023, at 10:00 a.m. Eastern Time to discuss the Company’s fourth quarter 2022 results, which will be announced prior to the market open on the same day. The conference call will be broadcast live over the Internet at http://ir.essentgroup.com/events-and-presentations/events/default.aspx. |
Essent's Catalyst Is The End To Economic UncertaintyPublished on the Value Lab 1/6/22 Essent (ESNT) is a private mortgage insurer (PMI), which means that it sells insurance in order to reduce LTVs on loans where downpayments are too low for GSE and the standards of most lenders. FICO scores of underlying borrowers are high, and reserves are actually shrinking since being frozen at COVID-19 danger levels, and macro indicators still look good for the company despite a very compressed multiple. The risk for them is claims from mortgage defaults, which are at historically low levels. Reserves should account for this, and there is a margin of safety for the US economy to suffer more befor... |
Essent''s Catalyst Is The End To Economic Uncertainty (ESNT)Essent''s reserves aren''t growing thankfully as they were already so high from COVID-19. See why I think ESNT stock is decent value at this price. |
Are Investors Undervaluing Essent Group (ESNT) Right Now?Here at Zacks, our focus is on the proven Zacks Rank system, which emphasizes earnings estimates and estimate revisions to find great stocks. Nevertheless, we are always paying attention to the latest value, growth, and momentum trends to underscore strong picks. |
Should Value Investors Buy Essent Group (ESNT) Stock?Here at Zacks, our focus is on the proven Zacks Rank system, which emphasizes earnings estimates and estimate revisions to find great stocks. Nevertheless, we are always paying attention to the latest value, growth, and momentum trends to underscore strong picks. |
ESNT Price Returns
1-mo | N/A |
3-mo | 15.19% |
6-mo | 3.43% |
1-year | -2.83% |
3-year | -6.86% |
5-year | -0.75% |
YTD | 12.65% |
2022 | -12.76% |
2021 | 7.06% |
2020 | -15.53% |
2019 | 53.00% |
2018 | -21.28% |
ESNT Dividends
Ex-Dividend Date | Type | Payout Amount | Change | ||||||
---|---|---|---|---|---|---|---|---|---|
Loading, please wait... |
Continue Researching ESNT
Here are a few links from around the web to help you further your research on Essent Group Ltd's stock as an investment opportunity:Essent Group Ltd (ESNT) Stock Price | Nasdaq
Essent Group Ltd (ESNT) Stock Quote, History and News - Yahoo Finance
Essent Group Ltd (ESNT) Stock Price and Basic Information | MarketWatch
Loading social stream, please wait...