Espey Mfg. & Electronics Corp. (ESP): Price and Financial Metrics
GET POWR RATINGS... FREE!
ESP Stock Summary
- For ESP, its debt to operating expenses ratio is greater than that reported by only 0.48% of US equities we're observing.
- Over the past twelve months, ESP has reported earnings growth of -1,093.89%, putting it ahead of only 1.56% of US stocks in our set.
- In terms of volatility of its share price, ESP is more volatile than just 4.05% of stocks we're observing.
- Stocks with similar financial metrics, market capitalization, and price volatility to ESPEY MFG & ELECTRONICS CORP are WTTR, TTCF, GIFI, ASIX, and BYRN.
- ESP's SEC filings can be seen here. And to visit ESPEY MFG & ELECTRONICS CORP's official web site, go to www.espey.com.
ESP Valuation Summary
- In comparison to the median Industrials stock, ESP's EV/EBIT ratio is 6.71% lower, now standing at 16.
- ESP's price/sales ratio has moved up 0.1 over the prior 243 months.
Below are key valuation metrics over time for ESP.
Stock | Date | P/S | P/B | P/E | EV/EBIT |
---|---|---|---|---|---|
ESP | 2023-01-24 | 1.3 | 1.3 | 24.6 | 16.0 |
ESP | 2023-01-23 | 1.3 | 1.3 | 24.8 | 16.1 |
ESP | 2023-01-20 | 1.2 | 1.3 | 24.0 | 15.5 |
ESP | 2023-01-19 | 1.2 | 1.3 | 23.9 | 15.4 |
ESP | 2023-01-18 | 1.3 | 1.3 | 24.4 | 15.9 |
ESP | 2023-01-17 | 1.3 | 1.3 | 24.4 | 15.8 |
ESP Growth Metrics
- Its 4 year net income to common stockholders growth rate is now at -18.54%.
- Its 3 year cash and equivalents growth rate is now at 389.37%.
- Its 4 year cash and equivalents growth rate is now at -53.22%.

The table below shows ESP's growth in key financial areas (numbers in millions of US dollars).
Date | Revenue | Operating Cash Flow | Net Income to Common Stock |
---|---|---|---|
2022-09-30 | 33.19514 | 1.605206 | 1.727332 |
2022-06-30 | 32.10477 | 2.219687 | 1.265127 |
2022-03-31 | 32.92548 | -0.782226 | 1.868375 |
2021-12-31 | 28.5105 | -2.056185 | 0.136902 |
2021-09-30 | 28.01451 | 0.804978 | -0.065305 |
2021-06-30 | 27.7346 | 0.594996 | -0.181543 |
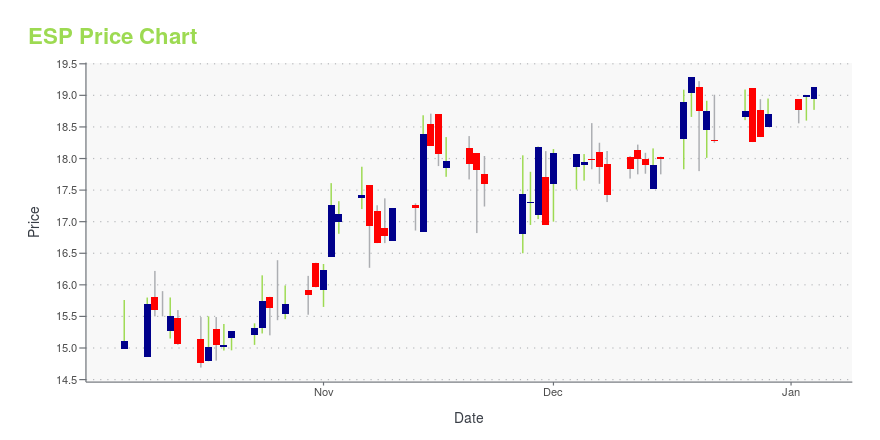
ESP Stock Price Chart Interactive Chart >
ESP Price/Volume Stats
Current price | $15.61 | 52-week high | $16.50 |
Prev. close | $16.01 | 52-week low | $12.39 |
Day low | $15.61 | Volume | 1,800 |
Day high | $16.01 | Avg. volume | 6,272 |
50-day MA | $14.20 | Dividend yield | N/A |
200-day MA | $13.89 | Market Cap | 42.19M |
Espey Mfg. & Electronics Corp. (ESP) Company Bio
Espey Mfg. & Electronics Corp., a power electronics design and original equipment manufacturing company, designs, manufactures, and tests electronic equipment primarily for use in military and industrial applications in the United States and internationally. Its principal products include power supplies, power converters, filters, power transformers, magnetic components, power distribution equipment, UPS systems, antennas, and high power radar systems for use in AC and DC locomotives, shipboard power, shipboard radar, airborne power, ground-based radar, and ground mobile power applications. The company also provides various services that consist of design and development to specification, build to print, design services, design studies, environmental testing services, metal fabrication, painting services, and development of automatic testing equipment. It serves industrial manufacturers and defense companies, the government of the United States, foreign governments, and foreign electronic equipment companies through its direct sales organization and outside sales representatives. Espey Mfg. & Electronics Corp. was founded in 1928 and is based in Saratoga Springs, New York.
Latest ESP News From Around the Web
Below are the latest news stories about ESPEY MFG & ELECTRONICS CORP that investors may wish to consider to help them evaluate ESP as an investment opportunity.
Espey Mfg. & Electronics Corp. reports first quarter resultsSARATOGA SPRINGS, N.Y., Nov. 10, 2022 (GLOBE NEWSWIRE) -- Espey Mfg. & Electronics Corp. (NYSE American: ESP) announces results for the first three months of fiscal year 2023. Net sales for the first quarter of fiscal year 2023, July 1 to September 30, 2022, were $8,635,795, compared with last year's first quarter net sales of $7,545,432. Net income for the quarter was $768,266, $0.31 per diluted share, as compared to net income of $306,061, $0.13 per diluted share for the same quarter last year |
Espey Mfg. & Electronics Corp. reports fourth quarter and year-end resultsSARATOGA SPRINGS, N.Y., Sept. 22, 2022 (GLOBE NEWSWIRE) -- Espey Mfg. & Electronics Corp. (NYSE American: ESP) announces results for its fourth quarter and fiscal year, ended June 30, 2022. For the fiscal year ended June 30, 2022, the Company reported net sales of $32,104,774 compared with $27,734,598 for the fiscal year ended June 30, 2021. Net income for the year was $1,265,127, $0.52 per diluted share, compared with a net loss of ($181,543), ($0.08) per diluted share, for the fiscal year ende |
Espey Mfg. & Electronics Corp. reports third quarter resultsSARATOGA SPRINGS, N.Y., May 16, 2022 (GLOBE NEWSWIRE) -- Espey Mfg. & Electronics Corp. (NYSE American: ESP) announces results for the first nine months of fiscal year 2022. Net sales for the third quarter of fiscal year 2022, January 1 to March 31, 2022, were $8,620,049 compared with last year's third quarter net sales of $4,205,068. Net income for the quarter was $661,359, $0.27 per diluted share, as compared to net loss of $(1,070,114), $(0.44) per diluted share for the same quarter last year |
Espey Mfg. & Electronics Corp. reports second quarter resultsSARATOGA SPRINGS, N.Y., Feb. 14, 2022 (GLOBE NEWSWIRE) -- Espey Mfg. & Electronics Corp. (NYSE American: ESP) announces results for the first six months of fiscal year 2022. Net sales for the second quarter of fiscal year 2022, October 1 to December 31, 2021, were $7,458,050 compared with last year's second quarter net sales of $6,962,065. Net income for the quarter was $21,201, $.01 per diluted share, as compared to net loss of $(181,006), $(0.08) per diluted share for the same quarter last yea |
ESP Price Returns
1-mo | 9.93% |
3-mo | 16.58% |
6-mo | 17.37% |
1-year | 19.68% |
3-year | -20.29% |
5-year | -26.32% |
YTD | 9.93% |
2022 | -0.07% |
2021 | -24.87% |
2020 | -7.86% |
2019 | -9.61% |
2018 | 11.35% |
Continue Researching ESP
Want to do more research on Espey Mfg & Electronics Corp's stock and its price? Try the links below:Espey Mfg & Electronics Corp (ESP) Stock Price | Nasdaq
Espey Mfg & Electronics Corp (ESP) Stock Quote, History and News - Yahoo Finance
Espey Mfg & Electronics Corp (ESP) Stock Price and Basic Information | MarketWatch
Loading social stream, please wait...