Esperion Therapeutics, Inc. (ESPR): Price and Financial Metrics
ESPR Price/Volume Stats
Current price | $2.68 | 52-week high | $3.34 |
Prev. close | $2.62 | 52-week low | $0.70 |
Day low | $2.54 | Volume | 8,248,100 |
Day high | $2.80 | Avg. volume | 6,423,410 |
50-day MA | $2.37 | Dividend yield | N/A |
200-day MA | $1.69 | Market Cap | 495.94M |
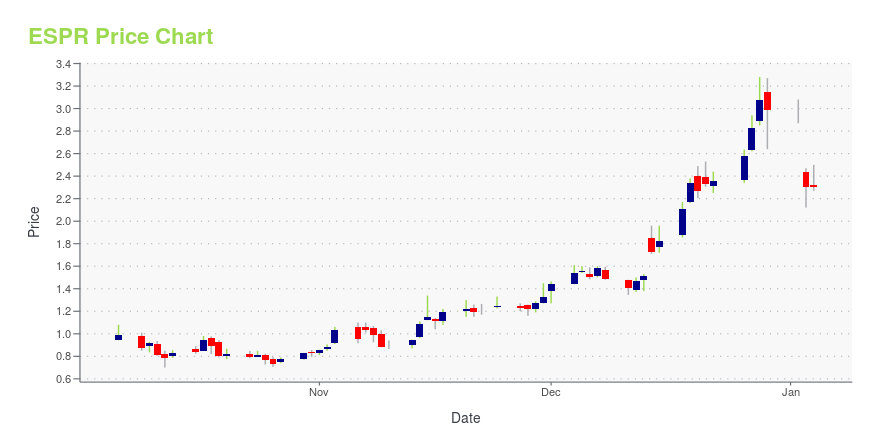
ESPR Stock Price Chart Interactive Chart >
ESPR POWR Grades
- ESPR scores best on the Growth dimension, with a Growth rank ahead of 94.04% of US stocks.
- ESPR's strongest trending metric is Stability; it's been moving down over the last 26 weeks.
- ESPR's current lowest rank is in the Stability metric (where it is better than 1.3% of US stocks).
ESPR Stock Summary
- The capital turnover (annual revenue relative to shareholder's equity) for ESPR is -0.25 -- better than just 6.7% of US stocks.
- ESPR's equity multiplier -- a measure of assets relative to shareholders'equity -- is greater than that of only 6.55% of US stocks.
- Revenue growth over the past 12 months for ESPERION THERAPEUTICS INC comes in at 42.8%, a number that bests 89.45% of the US stocks we're tracking.
- If you're looking for stocks that are quantitatively similar to ESPERION THERAPEUTICS INC, a group of peers worth examining would be PVCT, AXDX, NWBO, NEU, and FCEL.
- Visit ESPR's SEC page to see the company's official filings. To visit the company's web site, go to www.esperion.com.
ESPR Valuation Summary
- ESPR's price/earnings ratio is -1.6; this is 105.49% lower than that of the median Healthcare stock.
- Over the past 128 months, ESPR's EV/EBIT ratio has gone up 13.1.
Below are key valuation metrics over time for ESPR.
Stock | Date | P/S | P/B | P/E | EV/EBIT |
---|---|---|---|---|---|
ESPR | 2023-12-29 | 3.3 | -0.8 | -1.6 | -5.0 |
ESPR | 2023-12-28 | 3.4 | -0.9 | -1.7 | -5.1 |
ESPR | 2023-12-27 | 3.1 | -0.8 | -1.5 | -4.9 |
ESPR | 2023-12-26 | 2.9 | -0.7 | -1.4 | -4.7 |
ESPR | 2023-12-22 | 2.6 | -0.7 | -1.3 | -4.6 |
ESPR | 2023-12-21 | 2.6 | -0.6 | -1.3 | -4.5 |
ESPR Growth Metrics
- The 3 year price growth rate now stands at -87.06%.
- The 4 year net cashflow from operations growth rate now stands at -220.28%.
- The 5 year net income to common stockholders growth rate now stands at -160.36%.
The table below shows ESPR's growth in key financial areas (numbers in millions of US dollars).
Date | Revenue | Operating Cash Flow | Net Income to Common Stock |
---|---|---|---|
2022-12-31 | 75.475 | -174.827 | -233.659 |
2022-09-30 | 72.058 | -190.061 | -243.291 |
2022-06-30 | 67.487 | -216.397 | -257.56 |
2022-03-31 | 89.305 | -213.731 | -234.904 |
2021-12-31 | 78.447 | -263.809 | -269.108 |
2021-09-30 | 72.684 | -274.653 | -308.465 |
ESPR's Quality Factors
The “Quality” component of the POWR Ratings focuses on 31 different factors of a companies fundamentals and operational strength. Here are some key insights as we drill into the specifics of these quality attributes.- ESPR has a Quality Grade of C, ranking ahead of 47.39% of graded US stocks.
- ESPR's asset turnover comes in at 0.214 -- ranking 191st of 680 Pharmaceutical Products stocks.
- CLDX, JAGX, and CDMO are the stocks whose asset turnover ratios are most correlated with ESPR.
The table below shows ESPR's key quality metrics over time.
Period | Asset Turnover | Gross Margin | ROIC |
---|---|---|---|
2021-06-30 | 0.214 | 0.911 | -0.853 |
2021-03-31 | 0.770 | 0.982 | -0.522 |
2020-12-31 | 0.817 | 0.989 | -0.694 |
2020-09-30 | 0.898 | 0.997 | -0.670 |
2020-06-30 | 0.882 | 0.998 | -0.566 |
2020-03-31 | 0.020 | 0.994 | -2.191 |
ESPR Price Target
For more insight on analysts targets of ESPR, see our ESPR price target page. And for a list of of all stocks sorted by upside potential based on analyst target price, see our Top Price Target page.
Average Price Target | $75.91 | Average Broker Recommendation | 1.86 (Hold) |
Esperion Therapeutics, Inc. (ESPR) Company Bio
Esperion Therapeutics is focused on developing and commercializing first-in-class, oral, LDL-cholesterol-lowering therapies for the treatment of patients with hypercholesterolemia and other cardiometabolic risk markers. The company was founded in 1998 and is based in Ann Arbor, Michigan.
Latest ESPR News From Around the Web
Below are the latest news stories about ESPERION THERAPEUTICS INC that investors may wish to consider to help them evaluate ESPR as an investment opportunity.
Esperion to Participate in 42nd Annual J.P. Morgan Healthcare ConferenceANN ARBOR, Mich., Dec. 18, 2023 (GLOBE NEWSWIRE) -- Esperion (NASDAQ: ESPR) today announced its participation in the 42nd Annual J.P. Morgan Healthcare Conference. Sheldon Koenig, President and CEO, will deliver a corporate presentation on Wednesday, January 10, 2024, at 2:15 PM PT (5:15 PM ET). The Esperion management team will also be hosting investor meetings during the conference. To register for the live webcast, follow this link. A live audio webcast can be accessed on the investor and med |
Today’s Biggest Pre-Market Stock Movers: 10 Top Gainers and Losers on ThursdayIt's time to start the day off right with a look at the biggest pre-market stock movers to watch for Thursday morning! |
U.S. FDA Updates LDL-C Lowering Indication for Esperion’s NEXLETOL® (bempedoic acid) Tablet and NEXLIZET® (bempedoic acid and ezetimibe) Tablet– Updated Label Adds Primary Hyperlipidemia, Removes Maximally Tolerated Statin Requirement, Removes Limitation of Use – – Cardiovascular (CV) Risk Reduction Labels Remain on Track: in U.S. with PDUFA Date of March 31; in Europe with Anticipated Approval in 1H 2024 – ANN ARBOR, Mich., Dec. 13, 2023 (GLOBE NEWSWIRE) -- Esperion (NASDAQ: ESPR) announced today that the U.S. Food and Drug Administration (FDA) has approved an updated LDL-cholesterol lowering indication for NEXLETOL and NEXLIZET to in |
Why Is Catalyst (CPRX) Up 16.2% Since Last Earnings Report?Catalyst (CPRX) reported earnings 30 days ago. What's next for the stock? We take a look at earnings estimates for some clues. |
Why Is Esperion Therapeutics (ESPR) Up 51.4% Since Last Earnings Report?Esperion Therapeutics (ESPR) reported earnings 30 days ago. What's next for the stock? We take a look at earnings estimates for some clues. |
ESPR Price Returns
1-mo | 4.28% |
3-mo | -10.37% |
6-mo | 173.47% |
1-year | 60.48% |
3-year | -90.23% |
5-year | -93.33% |
YTD | -10.37% |
2023 | -52.01% |
2022 | 24.60% |
2021 | -80.77% |
2020 | -56.40% |
2019 | 29.63% |
Continue Researching ESPR
Want to do more research on Esperion Therapeutics Inc's stock and its price? Try the links below:Esperion Therapeutics Inc (ESPR) Stock Price | Nasdaq
Esperion Therapeutics Inc (ESPR) Stock Quote, History and News - Yahoo Finance
Esperion Therapeutics Inc (ESPR) Stock Price and Basic Information | MarketWatch
Loading social stream, please wait...