
Earthstone Energy, Inc. (ESTE): Price and Financial Metrics
ESTE Price/Volume Stats
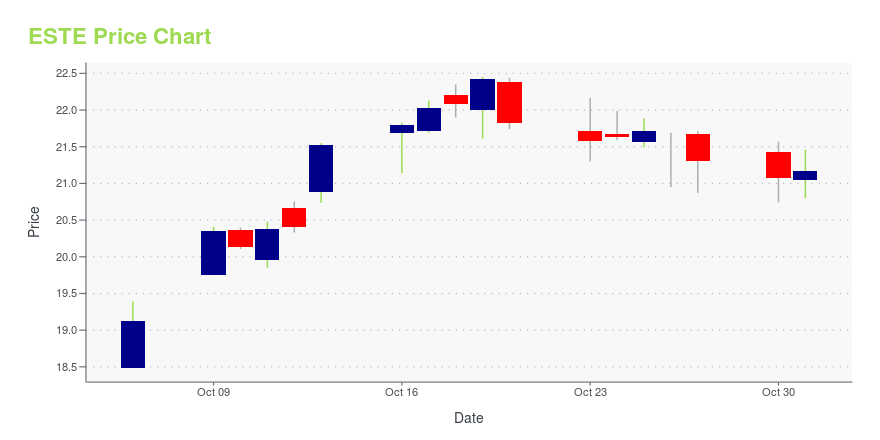
| Current price | $21.17 | 52-week high | $22.45 |
| Prev. close | $21.07 | 52-week low | $11.32 |
| Day low | $20.80 | Volume | 8,504,600 |
| Day high | $21.46 | Avg. volume | 1,514,334 |
| 50-day MA | $20.30 | Dividend yield | N/A |
| 200-day MA | $15.48 | Market Cap | 2.98B |
ESTE Stock Price Chart Interactive Chart >
Earthstone Energy, Inc. (ESTE) Company Bio
Earthstone Energy focuses on the acquisition, exploration, development, and production of onshore crude oil and natural gas reserves in the United States. The company was founded in 1969 and is based in The Woodlands, Texas.
Latest ESTE News From Around the Web
Below are the latest news stories about EARTHSTONE ENERGY INC that investors may wish to consider to help them evaluate ESTE as an investment opportunity.
Earnings Preview: Denbury (DEN) Q3 Earnings Expected to DeclineDenbury (DEN) doesn't possess the right combination of the two key ingredients for a likely earnings beat in its upcoming report. Get prepared with the key expectations. |
Earnings Preview: Earthstone Energy (ESTE) Q3 Earnings Expected to DeclineEarthstone Energy (ESTE) doesn't possess the right combination of the two key ingredients for a likely earnings beat in its upcoming report. Get prepared with the key expectations. |
Earthstone Declares ‘Special’ Cash DividendEarthstone's dividend is payable Nov. 6 to shareholders of record as of Oct. 31. |
Should Value Investors Buy Earthstone Energy (ESTE) Stock?Here at Zacks, our focus is on the proven Zacks Rank system, which emphasizes earnings estimates and estimate revisions to find great stocks. Nevertheless, we are always paying attention to the latest value, growth, and momentum trends to underscore strong picks. |
Earthstone Declares Cash DividendTHE WOODLANDS, Texas, Oct. 23, 2023 (GLOBE NEWSWIRE) -- Earthstone Energy, Inc. (NYSE: ESTE) (“Earthstone”, the “Company”), today announced that its Board of Directors declared a cash dividend of $0.1446 per share of Class A and Class B common stock. The dividend is payable on November 6, 2023, to shareholders of record as of October 31, 2023 who hold their shares through the closing of Earthstone’s previously announced merger with Permian Resources Corporation (NYSE: PR) (“Permian Resources”). |
ESTE Price Returns
| 1-mo | N/A |
| 3-mo | N/A |
| 6-mo | N/A |
| 1-year | 34.84% |
| 3-year | 112.98% |
| 5-year | 382.23% |
| YTD | N/A |
| 2023 | 0.00% |
| 2022 | 30.07% |
| 2021 | 105.25% |
| 2020 | -15.80% |
| 2019 | 40.04% |
Continue Researching ESTE
Here are a few links from around the web to help you further your research on Earthstone Energy Inc's stock as an investment opportunity:Earthstone Energy Inc (ESTE) Stock Price | Nasdaq
Earthstone Energy Inc (ESTE) Stock Quote, History and News - Yahoo Finance
Earthstone Energy Inc (ESTE) Stock Price and Basic Information | MarketWatch
Loading social stream, please wait...