Ethan Allen Interiors Inc. (ETD): Price and Financial Metrics
GET POWR RATINGS... FREE!
ETD POWR Grades
- ETD scores best on the Quality dimension, with a Quality rank ahead of 99.64% of US stocks.
- ETD's strongest trending metric is Growth; it's been moving down over the last 177 days.
- ETD's current lowest rank is in the Sentiment metric (where it is better than 25.62% of US stocks).
ETD Stock Summary
- ETHAN ALLEN INTERIORS INC's stock had its IPO on March 16, 1993, making it an older stock than 80.84% of US equities in our set.
- ETD's current price/earnings ratio is 5.9, which is higher than only 13.37% of US stocks with positive earnings.
- Of note is the ratio of ETHAN ALLEN INTERIORS INC's sales and general administrative expense to its total operating expenses; 97.07% of US stocks have a lower such ratio.
- If you're looking for stocks that are quantitatively similar to ETHAN ALLEN INTERIORS INC, a group of peers worth examining would be BSET, CVR, CIX, DNOW, and DYNT.
- ETD's SEC filings can be seen here. And to visit ETHAN ALLEN INTERIORS INC's official web site, go to www.ethanallen.com.
ETD Valuation Summary
- ETD's EV/EBIT ratio is 5; this is 62.96% lower than that of the median Consumer Cyclical stock.
- ETD's price/earnings ratio has moved down 8 over the prior 243 months.
Below are key valuation metrics over time for ETD.
Stock | Date | P/S | P/B | P/E | EV/EBIT |
---|---|---|---|---|---|
ETD | 2023-01-17 | 0.9 | 1.8 | 6.5 | 5.0 |
ETD | 2023-01-13 | 0.9 | 1.8 | 6.6 | 5.1 |
ETD | 2023-01-12 | 0.9 | 1.8 | 6.7 | 5.1 |
ETD | 2023-01-11 | 0.9 | 1.8 | 6.6 | 5.1 |
ETD | 2023-01-10 | 0.9 | 1.8 | 6.4 | 5.0 |
ETD | 2023-01-09 | 0.8 | 1.7 | 6.3 | 4.8 |
ETD Growth Metrics
- Its 3 year cash and equivalents growth rate is now at 269.22%.
- Its 5 year price growth rate is now at -60.24%.
- Its 3 year revenue growth rate is now at -0.25%.

The table below shows ETD's growth in key financial areas (numbers in millions of US dollars).
Date | Revenue | Operating Cash Flow | Net Income to Common Stock |
---|---|---|---|
2022-09-30 | 849.965 | 90.789 | 113.007 |
2022-06-30 | 817.762 | 69.356 | 103.28 |
2022-03-31 | 766.402 | 67.793 | 89.922 |
2021-12-31 | 745.705 | 86.695 | 80.816 |
2021-09-30 | 716.438 | 104.711 | 70.805 |
2021-06-30 | 685.169 | 129.912 | 60.005 |
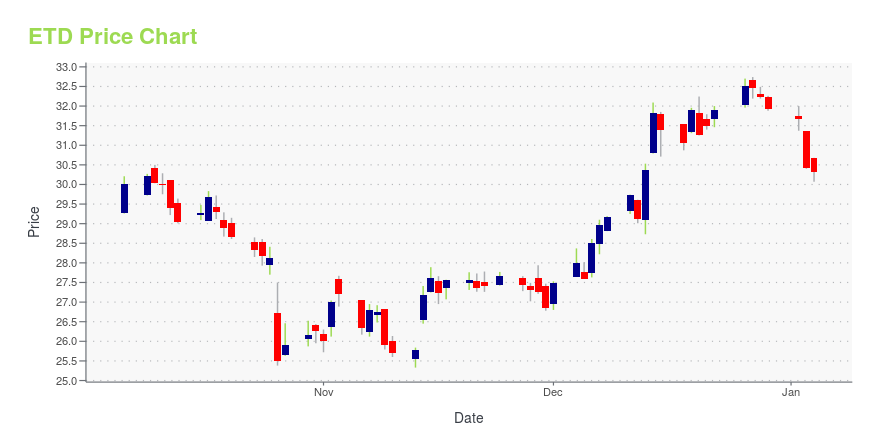
ETD Stock Price Chart Interactive Chart >
ETD Price/Volume Stats
Current price | $27.57 | 52-week high | $29.90 |
Prev. close | $27.00 | 52-week low | $19.60 |
Day low | $26.82 | Volume | 88,298 |
Day high | $27.59 | Avg. volume | 265,221 |
50-day MA | $27.48 | Dividend yield | 4.74% |
200-day MA | $24.58 | Market Cap | 698.82M |
Ethan Allen Interiors Inc. (ETD) Company Bio
Ethan Allen Interiors Inc. is an American furniture chain with about 300 stores across the United States, Canada, Europe, the Middle East and Asia. It was founded in 1932 by two brothers-in-law, Nathan S. Ancell and Theodore Baumritter.
Latest ETD News From Around the Web
Below are the latest news stories about ETHAN ALLEN INTERIORS INC that investors may wish to consider to help them evaluate ETD as an investment opportunity.
Ethan Allen Interiors Inc. (Q2 2023) Earnings Call TranscriptEthan Allen Interiors Inc. (ETD) Q2 2023 Earnings Conference Call January 25, 2023 05:00 p.m. ET Company Representatives Farooq Kathwari - Chairman, President, Chief Executive Officer Matt McNulty - Senior Vice President, Chief Financial Officer, Treasurer Conference Call Participants Brad Thomas - KeyBanc Capital Markets Cristina Fernández - Telsey Advisory Group Presentation Operator Good afternoon, and welcome to the Ethan Allen fiscal 2023 Second Quarter Analyst Conference Call. At this time all participants are in a listen-only mode. A brief question-and-answer session will follow the formal presentation. [Operator Instructions]. Please note that ... |
Ethan Allen Interiors Non-GAAP EPS of $1.10 beats by $0.21, revenue of $203.2M misses by $3.05M
|
Ethan Allen Reports Strong Fiscal 2023 Second Quarter Operating ResultsDANBURY, CT, Jan. 25, 2023 (GLOBE NEWSWIRE) -- Ethan Allen Interiors Inc. (“Ethan Allen” or the “Company”) (NYSE: ETD) today reported its financial and business results for its fiscal 2023 second quarter ended December 31, 2022. Farooq Kathwari, Ethan Allen’s Chairman, President and CEO commented, “We are pleased with our second quarter operating performance. Our strong delivered net sales of $203.2 million were helped by our backlog. Our gross margins increased to 61.0% and operating margins ro |
Ethan Allen Declares Regular Quarterly Cash DividendDANBURY, CT, Jan. 24, 2023 (GLOBE NEWSWIRE) -- Ethan Allen Interiors Inc. (“Ethan Allen” or the “Company”) (NYSE: ETD) announced today that its Board of Directors declared a regular quarterly cash dividend of $0.32 per share, payable on February 21, 2023, to shareholders of record at the close of business on February 7, 2023. Farooq Kathwari, Ethan Allen’s Chairman, President and CEO commented, “We are pleased to continue to provide strong returns to shareholders in the form of cash dividends wh |
Ethan Allen Announces Earnings Release Date for its Fiscal 2023 Second Quarter ResultsDANBURY, CT, Jan. 04, 2023 (GLOBE NEWSWIRE) -- Ethan Allen Interiors Inc. (“Ethan Allen” or the “Company”) (NYSE: ETD) today announced that it will release its financial and business results for the fiscal 2023 second quarter ended December 31, 2022, after the market closes on Wednesday, January 25, 2023. Following the release, the Company will host an analyst conference call at 5:00 PM (Eastern Time) to discuss its results. The analyst conference call will be webcast live from the Company’s Inv |
ETD Price Returns
1-mo | 4.35% |
3-mo | 6.10% |
6-mo | 23.35% |
1-year | 21.38% |
3-year | 109.96% |
5-year | 55.32% |
YTD | 4.35% |
2022 | 7.47% |
2021 | 44.17% |
2020 | 11.29% |
2019 | 18.89% |
2018 | -35.80% |
ETD Dividends
Ex-Dividend Date | Type | Payout Amount | Change | ||||||
---|---|---|---|---|---|---|---|---|---|
Loading, please wait... |
Loading social stream, please wait...