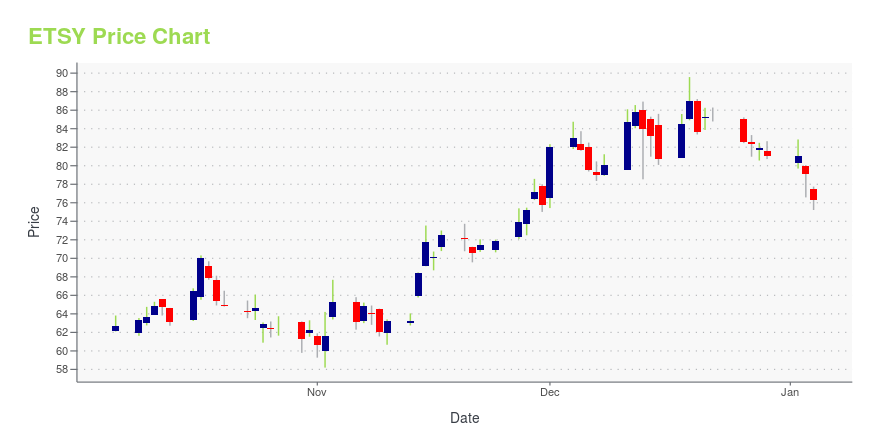
Etsy Inc. (ETSY): Price and Financial Metrics
GET POWR RATINGS... FREE!
ETSY Price/Volume Stats
Current price | $85.53 | 52-week high | $149.91 |
Prev. close | $86.23 | 52-week low | $67.01 |
Day low | $84.96 | Volume | 3,456,900 |
Day high | $87.34 | Avg. volume | 3,286,875 |
50-day MA | $99.89 | Dividend yield | N/A |
200-day MA | $112.78 | Market Cap | 10.55B |
ETSY Stock Price Chart Interactive Chart >
ETSY POWR Grades
- ETSY scores best on the Quality dimension, with a Quality rank ahead of 97.69% of US stocks.
- The strongest trend for ETSY is in Quality, which has been heading up over the past 179 days.
- ETSY ranks lowest in Sentiment; there it ranks in the 5th percentile.
ETSY Stock Summary
- ETSY INC's capital turnover -- a measure of revenue relative to shareholder's equity -- is better than just 3.08% of US listed stocks.
- ETSY's equity multiplier -- a measure of assets relative to shareholders'equity -- is greater than that of merely 2.12% of US stocks.
- In terms of twelve month growth in earnings before interest and taxes, ETSY INC is reporting a growth rate of -259.89%; that's higher than merely 6.37% of US stocks.
- Stocks that are quantitatively similar to ETSY, based on their financial statements, market capitalization, and price volatility, are JAZZ, CPRX, SUPN, MTCH, and VAPO.
- ETSY's SEC filings can be seen here. And to visit ETSY INC's official web site, go to www.etsy.com.
ETSY Valuation Summary
- In comparison to the median Technology stock, ETSY's price/sales ratio is 61.54% higher, now standing at 4.2.
- Over the past 99 months, ETSY's EV/EBIT ratio has gone up 322.7.
Below are key valuation metrics over time for ETSY.
Stock | Date | P/S | P/B | P/E | EV/EBIT |
---|---|---|---|---|---|
ETSY | 2023-05-22 | 4.2 | -20.6 | -15.7 | -19.5 |
ETSY | 2023-05-19 | 4.2 | -20.3 | -15.6 | -19.3 |
ETSY | 2023-05-18 | 4.3 | -21.1 | -16.1 | -19.9 |
ETSY | 2023-05-17 | 4.5 | -21.7 | -16.6 | -20.4 |
ETSY | 2023-05-16 | 4.3 | -21.2 | -16.2 | -20.0 |
ETSY | 2023-05-15 | 4.6 | -22.3 | -17.1 | -20.9 |
ETSY Growth Metrics
- Its 3 year cash and equivalents growth rate is now at 116.96%.
- Its 3 year net income to common stockholders growth rate is now at 353.52%.
- Its 2 year net cashflow from operations growth rate is now at 174.29%.

The table below shows ETSY's growth in key financial areas (numbers in millions of US dollars).
Date | Revenue | Operating Cash Flow | Net Income to Common Stock |
---|---|---|---|
2022-12-31 | 2,566.111 | 683.612 | -694.288 |
2022-09-30 | 2,476.009 | 682.321 | -642.279 |
2022-06-30 | 2,413.969 | 566.687 | 410.719 |
2022-03-31 | 2,357.734 | 562.63 | 435.85 |
2021-12-31 | 2,329.114 | 651.551 | 493.507 |
2021-09-30 | 2,229.33 | 604.759 | 480.488 |
ETSY's Quality Factors
The “Quality” component of the POWR Ratings focuses on 31 different factors of a companies fundamentals and operational strength. Here are some key insights as we drill into the specifics of these quality attributes.- ETSY has a Quality Grade of A, ranking ahead of 99.67% of graded US stocks.
- ETSY's asset turnover comes in at 0.763 -- ranking 197th of 563 Business Services stocks.
- TSRI, PCOM, and RRD are the stocks whose asset turnover ratios are most correlated with ETSY.
The table below shows ETSY's key quality metrics over time.
Period | Asset Turnover | Gross Margin | ROIC |
---|---|---|---|
2021-09-30 | 0.763 | 0.733 | 0.222 |
2021-06-30 | 0.826 | 0.738 | 0.265 |
2021-03-31 | 0.923 | 0.744 | 0.350 |
2020-12-31 | 0.874 | 0.731 | 0.283 |
2020-09-30 | 0.783 | 0.706 | 0.194 |
2020-06-30 | 0.712 | 0.686 | 0.142 |
ETSY Price Target
For more insight on analysts targets of ETSY, see our ETSY price target page. And for a list of of all stocks sorted by upside potential based on analyst target price, see our Top Price Target page.
Average Price Target | $221.37 | Average Broker Recommendation | 1.45 (Moderate Buy) |
Etsy Inc. (ETSY) Company Bio
Etsy, Inc. is an American e-commerce company focused on handmade or vintage items and craft supplies. These items fall under a wide range of categories, including jewelry, bags, clothing, home décor and furniture, toys, art, as well as craft supplies and tools. Items described as vintage must be at least 20 years old. The site follows in the tradition of open craft fairs, giving sellers personal storefronts where they list their goods for a fee of US$0.20 per item. (Source:Wikipedia)
Latest ETSY News From Around the Web
Below are the latest news stories about ETSY INC that investors may wish to consider to help them evaluate ETSY as an investment opportunity.
Etsy: Buy, Sell, or Hold?Etsy shares have fallen 57% since the start of 2022 and 22% this year alone. Here's why investors might still want to consider buying Etsy for their portfolios. Despite what Etsy's share-price performance might suggest, the business just reported what I think was a generally good quarter. |
Etsy to Participate in Upcoming Investor ConferenceEtsy, Inc. (Nasdaq: ETSY), which operates two-sided online marketplaces that connect millions of passionate and creative buyers and sellers around the world, today announced participation including a webcasted fireside chat at the Bernstein 39th Annual Strategic Decisions Conference in New York City on May 31, 2023 at 11:00 a.m. ET. The live webcast and replay of this session will be featured on our IR website at investors.etsy.com. |
Capital One Is One Of The Top S&P 500 Gainers. Etsy Is Falling the Most.Capital One Financial (ticker: COF) shares rose 2.8%, a day after news that Berkshire Hathaway (BRK.A, BRK.B) [initiated a position in the bank](https://www.barrons.com/articles/berkshire-hathaway-13f-stock-apple-occidental-chevron-coca-cola-6589ebf8), buying a stake of 9. |
Is the Options Market Predicting a Spike in Etsy (ETSY) Stock?Investors need to pay close attention to Etsy (ETSY) stock based on the movements in the options market lately. |
3 Short-Squeeze Stocks Set for a Spectacular RallyThese are not only the best short-squeeze stocks for a spectacular rally, but also excellent picks for long-term returns. |
ETSY Price Returns
1-mo | -15.34% |
3-mo | -29.55% |
6-mo | -35.25% |
1-year | 4.11% |
3-year | 5.62% |
5-year | 169.73% |
YTD | -28.59% |
2022 | -45.29% |
2021 | 23.06% |
2020 | 301.60% |
2019 | -6.87% |
2018 | 132.62% |
Continue Researching ETSY
Here are a few links from around the web to help you further your research on Etsy Inc's stock as an investment opportunity:Etsy Inc (ETSY) Stock Price | Nasdaq
Etsy Inc (ETSY) Stock Quote, History and News - Yahoo Finance
Etsy Inc (ETSY) Stock Price and Basic Information | MarketWatch
Loading social stream, please wait...